Advertisements
Advertisements
Question
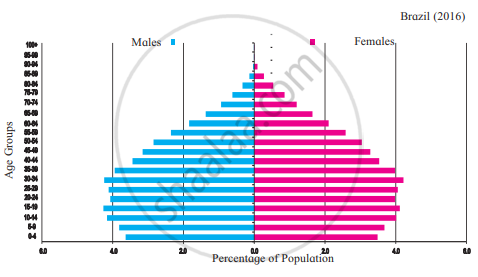
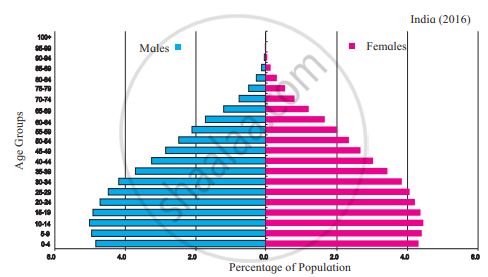
- Using the graphs given, find the difference between the males and females of various age groups.
- In which age group is this difference the maximum?
Very Long Answer
Advertisements
Solution
- The difference between males and females of various age groups are:
- In Brazil (2016): The percentage of males and females in almost every age group is nearly equal and balanced. However, in the senior age groups (above 60), the proportion of females is slightly higher than males.
- In India (2016): The population structure is highly tilted toward men. Almost all children, youth, and adult age groups (from 0 to 45 years the percentage of males is visibly higher than the percentage of females.
-
- This difference is the maximum in the following age groups in Brazil: (1) 10 to 14 (2) 70 to 74 (3) 75 to 79 (4) 80 to 84 (5) 85 to 89 (6) 90 to 94.
- This difference is the maximum in the following age groups in India: (1) 0 to 4 (2) 5 to 9 (3) 10 to 14 (4) 15 to 19 (5) 20 to 24 (6) 25 to 29 (7) 90 to 94.
shaalaa.com
Is there an error in this question or solution?
