Please select a subject first
Advertisements
Advertisements
Advertisements
Find the value of:
`("log"sqrt(8))/(8)`
Concept: undefined >> undefined
Find the value of:
`("log"sqrt(27) + "log"8 + "log"sqrt(1000))/("log"120)`
Concept: undefined >> undefined
Find the value of:
`("log"sqrt125 - "log"sqrt(27) - "log"sqrt(8))/("log"6 - "log"5)`
Concept: undefined >> undefined
The diagonals PR and QS of a quadrilateral PQRS are perpendicular to each other. A, B, C and D are mid-point of PQ, QR, RS and SP respectively. Prove that ABCD is a rectangle.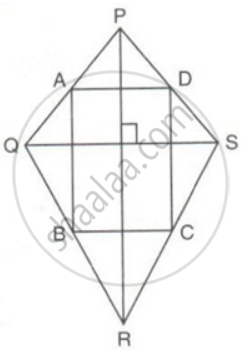
Concept: undefined >> undefined
PQRS is a parallelogram. M and N are the mid-points of the adjacent sides QR and RS. O is the mid-point of the diagonal PR. Prove that MONR is a rectangle and MN is half of PR.
Concept: undefined >> undefined
ABCD is a quadrilateral in which diagonals AC and BD intersect at a point O. Prove that: areaΔAOD + areaΔBOC + areaΔABO + areaΔCDO.
Concept: undefined >> undefined
Harmeet earns Rs.50 000 per month. He a budget for his salary as per the following table:
| Expenses | Accommodation | Food | Clothing | Travel | Miscellaneous | saving |
| Amount (Rs.) | 12000 | 9000 | 2500 | 7500 | 4000 | 15000 |
Draw a bar graph for the above data.
Concept: undefined >> undefined
The birth rate thousand of the following states over a certain period is given below:
| States | Punjab | Haryana | U.P. | Gujarat | Rajasthan | Jammu and Kashmir |
| Birth Rate (per thousand ) | 22.9 | 21.8 | 19.5 | 21.1 | 23.9 | 18.3 |
Draw a bar graph for the above data.
Concept: undefined >> undefined
The number of students (boys and girls) of class IX participating in different activities during their annual day function is given below:
| Activities | Dance | Speech | Singing | Quiz | Drama | Anchoring |
| Boys | 12 | 5 | 4 | 4 | 10 | 2 |
| Girls | 10 | 8 | 6 | 3 | 9 | 1 |
Draw a double bar graph for the above data.
Concept: undefined >> undefined
Read the following bar graph and answer the following questions:
a. What information is given by the graph?
b. Which state is the largest producer of wheat?
c. Which state is the largest producer of sugar?
d. Which state has total production of wheat and sugar as its maximum?
e. Which state has the total production of wheat and sugar minimum?
Concept: undefined >> undefined
Find if the following points are collinear or not by using a graph:
(i) (-2, -1), (0, 3) and (1, 5)
(ii) (1, 3), (-2, -4) and (3, 5)
(iii) (2, -1), (2, 5) and (2, 7)
(iv) (4, -1), (-5, -1) and (3, -1)
Concept: undefined >> undefined
Draw a graph of each of the following equations: x + 6y = 15
Concept: undefined >> undefined
Draw a graph of each of the following equations: 3x - 2y = 6
Concept: undefined >> undefined
Draw a graph of each of the following equations: 3y + 2x = 11
Concept: undefined >> undefined
Draw a graph of each of the following equations: 5x + 2y = 16
Concept: undefined >> undefined
Draw a graph of each of the following equations: x + y - 3 = 0
Concept: undefined >> undefined
Draw a graph of each of the following equations: x = -3y
Concept: undefined >> undefined
Draw a graph of each of the following equations: y = `(5)/(2) xx + (2)/(5)`
Concept: undefined >> undefined
