Advertisements
Advertisements
प्रश्न
Draw a graph of each of the following equations: x + 6y = 15
Advertisements
उत्तर
x + 6y = 15
⇒ x = 15 - 6y
When y = 1, x = 15 - 6(1) = 9
When y =2, x = 15 - 6(2) = 3
When y = 3, x = 15 - 6(3) = -3
| x | 9 | 3 | -3 |
| y | 1 | 2 | 3 |
Plotting the points (9, 1), (3, 2) and (-3, 3), we get the line segment as shown in the figure.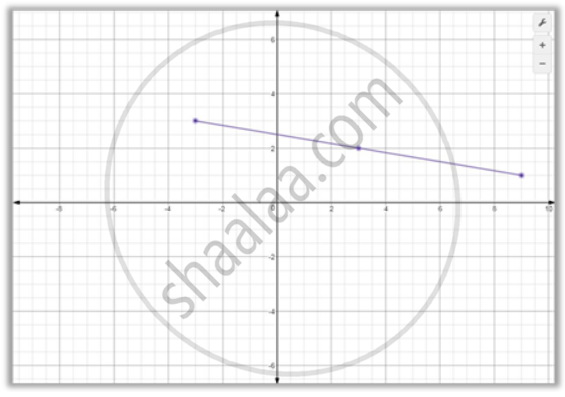
APPEARS IN
संबंधित प्रश्न
Draw the graph for the linear equation given below:
y = x
Draw the graph for the linear equation given below:
y = `(2x)/(3) - 1`
Draw the graph for the linear equation given below:
x + 5y + 2 = 0
Draw the graph for the equation given below:
2x - 5y = 10
For the pair of linear equations given below, draw graphs and then state, whether the lines drawn are parallel or perpendicular to each other.
2x - 3y = 6
`x/(2) + y/(3) = 1`
Use the graphical method to show that the straight lines given by the equations x + y = 2, x - 2y = 5 and `x/(3) + y = 0` pass through the same point.
Draw a graph of each of the following equations: 3x - 2y = 6
Draw a graph of each of the following equations: 2(x - 5) = `(3)/(4)(y - 1)`
Draw a graph of the equation 2x + 3y + 5 = 0, from the graph find the value of:
(i) x, when y = -3
(ii) y, when x = 8
Draw the graph of the lines represented by the equations 3x - 2y = 4 and x + y = 3 on the same graph. Find the coordinates of the point where they intersect. State, whether the lines are perpendicular to each other.
