Please select a subject first
Advertisements
Advertisements
Observe the following:
1 + 2 – 3 + 4 + 5 – 6 – 7 + 8 – 9 = –5
Change one ‘–’ sign as ‘+’ sign to get the sum 9.
Concept: undefined >> undefined
Pictographs and bar graphs are pictorial representations of the numerical data.
Concept: undefined >> undefined
Advertisements
In a pictograph, if a symbol ![]() represents 50 books in a library shelf, then the symbol
represents 50 books in a library shelf, then the symbol ![]() represents 25 books.
represents 25 books.
Concept: undefined >> undefined
A ______ represents data through pictures of objects.
Concept: undefined >> undefined
In a pictograph, if a symbol ![]() represents 20 flowers in a basket then
represents 20 flowers in a basket then ![]() stands for ______ flowers.
stands for ______ flowers.
Concept: undefined >> undefined
On the scale of 1 unit length = 10 crore, the bar of length 6 units will represent ______ crore and of ______ units will represent 75 crore.
Concept: undefined >> undefined
Following pictograph represents some surnames of people listed in the telephone directory of a city.
| Surname | Number of people |
| Khan |  |
| Patel |  |
| Rao |  |
| Roy |  |
| Saikia |  |
| Singh |  |
Observe the pictograph and answer the following questions:
- How many people have surname ‘Roy’?
- Which surname appears the maximum number of times in the telephone directory?
- Which surname appears the least number of times in the directory?
- Which two surnames appear an equal number of times?
Concept: undefined >> undefined
Students of Class VI in a school were given a task to count the number of articles made of different materials in the school.
The information collected by them is represented as follows:
| Material used | Articles |
| Wood |  |
| Glass |  |
| Metal |  |
| Rubber |  |
| Plastic |  |
Observe the pictograph and answer the following questions:
- Which material is used in maximum number of articles?
- Which material is used in minimum number of articles?
- Which material is used in exactly half the number of articles as those made up of metal?
- What is the total number of articles counted by the students?
Concept: undefined >> undefined
The number of scouts in a school is depicted by the following pictograph:
| Class | Number of scouts |
| VI |  |
| VII |  |
| VIII |  |
| IX |  |
| X |  |
Observe the pictograph and answer the following questions:
- Which class has the minimum number of scouts?
- Which class has the maximum number of scouts?
- How many scouts are there in Class VI?
- Which class has exactly four times the scouts as that of Class X?
- What is the total number of scouts in the Classes VI to X?
Concept: undefined >> undefined
A survey was carried out in a certain school to find out the popular school subjects among students of Classes VI to VIII.
The data in this regard is displayed as pictograph given below:
| Subject | Number of Students |
| Hindi | |
| English | |
| Mathematics | |
| Science | |
| Social Studies |
- Which subject is most popular among the students?
- How many students like Mathematics?
- Find the number of students who like subjects other than Mathematics and Science.
Concept: undefined >> undefined
The following pictograph depicts the information about the areas in sq km (to nearest hundred) of some districts of Chhattisgarh State:
| District | Area (in km2) |
| Raigarh |  |
| Rajnandgaon |  |
| Koria |  |
| Mahasamund |  |
| Kabirdham |  |
| Jashpur |  |
- What is the area of Koria district?
- Which two districts have the same area?
- How many districts have area more than 5000 square kilometres?
Concept: undefined >> undefined
The number of bottles of cold drinks sold by a shopkeeper on six consecutive days is as follows:
| Day | Sunday | Monday | Tuesday | Wednesday | Thursday | Friday |
| Number of bottles | 350 | 200 | 300 | 250 | 100 | 150 |
Prepare a pictograph of the data using one symbol to represent 50 bottles.
Concept: undefined >> undefined
The following table gives information about the circulation of newspapers (dailies) in a town in five languages.
| Language | English | Hindi | Tamil | Punjabi | Gujarati |
| Number of newspapers |
5000 | 8500 | 500 | 2500 | 1000 |
Prepare a pictograph of the above data, using a symbol of your choice, each representing 1000 newspapers.
Concept: undefined >> undefined
Annual expenditure of a company in the year 2007-2008 is given below:
| Items | Expenditure (Rs in lakh) |
| Salaries of employees | 65 |
| Advertisement | 10 |
| Purchase of machinery | 85 |
| Electricity and water | 15 |
| Transportation | 25 |
| Other expenses | 30 |
Prepare a pictograph of the above data using an appropriate symbol to represent Rs 10 lakh.
Concept: undefined >> undefined
Prepare a pictograph of the information given in the question.
Scale: 1 unit length = 10 tickets
Concept: undefined >> undefined
The following table shows the area of the land on which different crops were grown.
| Crop | Area of land (in million hectares) |
| Rice | 50 |
| Wheat | 30 |
| Pulses | 20 |
| Sugarcane | 25 |
| Cotton | 15 |
Prepare a pictograph by choosing a suitable symbol to represent 10 million hectares.
Concept: undefined >> undefined
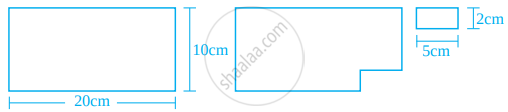
Length and breadth of a rectangular sheet of paper are 20 cm and 10 cm, respectively. A rectangular piece is cut from the sheet as shown in the following figure. Which of the following statements is correct for the remaining sheet?
Concept: undefined >> undefined
Length of a rectangle is three times its breadth. Perimeter of the rectangle is 40 cm. Find its length and width.
Concept: undefined >> undefined
There is a rectangular lawn 10 m long and 4 m wide in front of Meena’s house (see the figure). It is fenced along the two smaller sides and one longer side leaving a gap of 1 m for the entrance. Find the length of fencing.
Concept: undefined >> undefined
The length of a rectangular field is twice its breadth. Jamal jogged around it four times and covered a distance of 6 km. What is the length of the field?
Concept: undefined >> undefined
