Advertisements
Advertisements
प्रश्न
On the scale of 1 unit length = 10 crore, the bar of length 6 units will represent ______ crore and of ______ units will represent 75 crore.
Advertisements
उत्तर
On the scale of 1 unit length = 10 crore, the bar of length 6 units will represent 60 crore and of 7.5 units will represent 75 crore.
Explanation:
Given, 1 unit length = 10 crore
∴ 6 units length = 10 crore × 6 = 60 crore
And 75 crore = `(75 "crore")/(10 "crore") = 7 1/2` units
APPEARS IN
संबंधित प्रश्न
The following pictograph shows the number of cars sold by four dealers A, B, C and D in a city. Scale:  = 50 cars.
| Dealer | Number of cars |
| A |       |
| B |      |
| C |         |
| D |     |
Using the pictograph, drawn above, answer the following questions:
What is the total number of cars sold by all the dealers?
A Pictograph is also known as _____________
In a pictograph, if a symbol  represents 50 books in a library shelf, then the symbol
  represents 25 books.
In a pictograph, if a symbol  represents 20 flowers in a basket then
  stands for ______ flowers.
A survey was carried out in a certain school to find out the popular school subjects among students of Classes VI to VIII.
The data in this regard is displayed as pictograph given below:
| Subject | Number of Students  = 50 students = 50 students |
| Hindi |  |
| English |  |
| Mathematics |  |
| Science |  |
| Social Studies |  |
- Which subject is most popular among the students?
- How many students like Mathematics?
- Find the number of students who like subjects other than Mathematics and Science.
The following pictograph depicts the information about the areas in sq km (to nearest hundred) of some districts of Chhattisgarh State:
| District | Area (in km2)  = 1000 sq km = 1000 sq km |
| Raigarh |  |
| Rajnandgaon |  |
| Koria |  |
| Mahasamund |  |
| Kabirdham |  |
| Jashpur |  |
- What is the area of Koria district?
- Which two districts have the same area?
- How many districts have area more than 5000 square kilometres?
The following table gives information about the circulation of newspapers (dailies) in a town in five languages.
| Language | English | Hindi | Tamil | Punjabi | Gujarati |
| Number of newspapers |
5000 | 8500 | 500 | 2500 | 1000 |
Prepare a pictograph of the above data, using a symbol of your choice, each representing 1000 newspapers.
Prepare a pictograph of the information given in the question.
Scale: 1 unit length = 10 tickets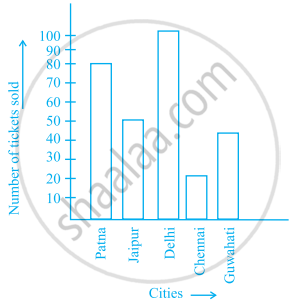
What does the scale in a pictograph indicate?
In preparing a pictograph for the data: Farming (60), Private Job (20), Government Job (30), and Other (40), which scale would be most efficient?
