Advertisements
Advertisements
प्रश्न
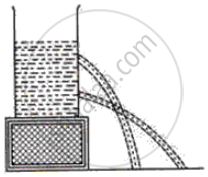
What fact about liquid pressure does the following diagram in the following figure illustrate?
Advertisements
उत्तर

This diagram illustrates that pressure of liquid increases with depth. The hole at greater depth has more pressure and hence the flow of liquid from there is more. Other hole is at less depth so the pressure of liquid there is less and hence the flow of liquid from there is less. So the diagram shows that pressure increases with an increase in depth.
APPEARS IN
संबंधित प्रश्न
What vertical height of water will exert a pressure of 333200 Pa? The density of water is 1000 kgnr3 and g = 9.8 ms−2.
Pressure at the bottom of the sea at some particular place is 8968960 Pa. If the density of seawater is 1040 kgm3 calculate the depth of the sea. Take g = 9.8 ms−2. Neglect the pressure of the atmosphere.
The pressure of water on the ground floor, in a water pipe is 150000 Pa, whereas pressure on the fourth floor is 30000 Pa. Calculate the height of the fourth floor. Take g = 10 ms−2.
The normal pressure of air is 76 cm of mercury. Calculate the pressure in SI units.
[Density of mercury = 13600 kg/m3 and g = 10 m/s2]
What do you mean by relative density?
