Advertisements
Advertisements
प्रश्न
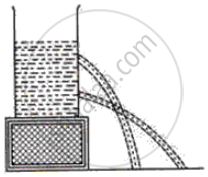
What fact about liquid pressure does the following diagram in the following figure illustrate?
Advertisements
उत्तर

This diagram illustrates that pressure of liquid increases with depth. The hole at greater depth has more pressure and hence the flow of liquid from there is more. Other hole is at less depth so the pressure of liquid there is less and hence the flow of liquid from there is less. So the diagram shows that pressure increases with an increase in depth.
APPEARS IN
संबंधित प्रश्न
Calculate the pressure exerted by 0.8 m vertical length of alcohol of density 0.80 gcnr5 in SI units.
[Take g = 10 ms−2].
What is the pressure exerted by 75 cm vertical column of mercury of density 13600 kgm−3 in SI units?
[Take g = 9.8 ms−2].
What vertical height of water will exert a pressure of 333200 Pa? The density of water is 1000 kgnr3 and g = 9.8 ms−2.
The pressure of water on the ground floor is 160000 Pa. Calculate the pressure on the fifth floor, at a height of 15 m.
(i) Calculate the height of a water column which will exert on its base the same
Pressure as the 70 cm column of mercury.
(ii) Will the height of the water column change if the cross-section of the water column is made wider?
What do you mean by relative density?
