Advertisements
Advertisements
प्रश्न
Given below is a diagram of a human kidney, cut open longitudinally. Answer the following:

(i) Give definition of excretion.
(ii) Name the unit of kidney.
(iii) Why does the cortex of kidney show dotted appearance?
(iv) List the functions of the kidney.
Advertisements
उत्तर
(i) Separation and elimination of the metabolic nitrogenous wastes from the body is called excretion.
(ii) Nephron.
(iii) The cortex of kidney shows dotted appearance because it contains numerous complex structures called nephrons.
(iv) Formation of urine and osmoregulation are important functions of kidney.
संबंधित प्रश्न
Explain the principle of dialysis with the help of a labelled diagram.
Answer the following in detail.
Describe the process of urine formation.
Fill in the blanks in the following passage to make it a meaningful description.
In a nephron, the ______ flows through the ______ under great pressure. The reason for this great pressure is that the ______ (outgoing) ______ is narrower than the ______ (incoming). This high pressure causes the ______ part of the blood to filter out from the ______ into the ______ capsule.
Define the following term :
Renal pelvis
Choose the correct answer:
What happens if one kidney is removed from the body of human being?
Study the diagram given alongside and then answer the question that follow:
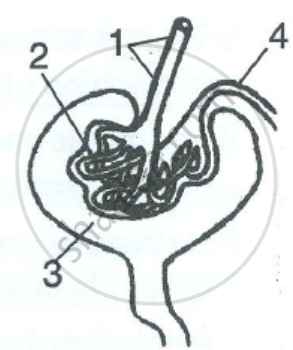
Name the parts labelled 1, 2, 3, and 4.
Differentiate between:
Ureter and Urethra.
Study the diagram given below and then answer the questions that follow:
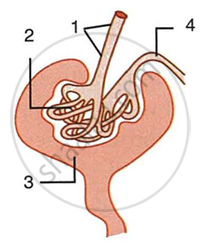 |
- Name the region in the kidney where the above structure is present?
- Name the parts labelled 1, 2, 3 and 4.
- Name the stages involved in the formation of urine.
- What is the technical term given to the process occurring in 2 and 3? Briefly describe the process.
Write the functional activity of the following structure: Renal vein
The statement given below is false. Rewrite the correct form of the statement by changing the underlined word.
The pigment urochrome is the breakdown product of the haemoglobin of dead RBCs.
