Advertisements
Advertisements
प्रश्न
On the same graph paper, plot the graphs of y = 2x - 1, y = 2x and y = 2x + 1 from x = - 2 to x = 4. Are the graphs (lines) drawn parallel to each other?
Advertisements
उत्तर
First, prepare a table as follows:
| X | -1 | 0 | 1 |
| Y = 2x - 1 | -3 | -1 | 1 |
| Y = 2x | -2 | 0 | 2 |
| Y = 2x + 1 | -1 | 1 | 3 |
Now the graph can be drawn as follows:
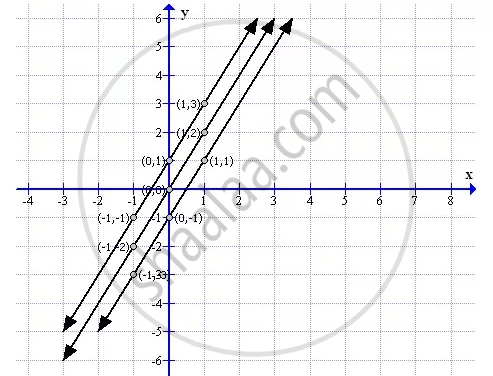
The lines are parallel to each other.
APPEARS IN
संबंधित प्रश्न
Draw the graph for the linear equation given below:
2x - 7 = 0
Draw the graph for the linear equation given below:
2y - 5 = 0
Draw the graph for the linear equation given below:
x = 0
Draw the graph for the linear equation given below:
y = x
Draw the graph for the linear equation given below:
5x+ y = 0.
Draw the graph for the linear equation given below:
y = 2x + 3
For the linear equation, given above, draw the graph and then use the graph drawn (in the following case) to find the area of a triangle enclosed by the graph and the co-ordinates axes:
3x − (5 − y) = 7
Draw a graph of each of the following equations: 3x - 2y = 6
Draw a graph of each of the following equations: y = `(3)/(5) x - 1`
Draw a graph for each of the following equations and find the coordinates of the points where the line drawn meets the x-axis and y-axis: 2x + 3y = 12
