Advertisements
Advertisements
प्रश्न
| Favourite sweet | Number of people |
| Jalebi | 20 |
| Rasgulla | 18 |
| Jamun | 25 |
| Laddoo | 22 |
| Burfi | 17 |
| Kalakand | 15 |
विकल्प
Rasgulla and Burfi
Jalebi and Laddoo
Kalakand and Jamun
Burfi and Jalebi
Advertisements
उत्तर
Rasgulla is liked more than Burfi.
APPEARS IN
संबंधित प्रश्न
Use a scale and find out from your chart:
- The length of the longest strip is ______ cm.
- So, ______ has the biggest head.
- The smallest strip is ______ cm long. It belongs to ______
Who likes to get wet in the rain? A child made this Chapati Chart after asking his friends.

See the Chapati Chart and tell -
- How many children like to get wet in the rain?
(a) Half
(b) One-fourth
(c) Three-fourth - How many children do not like to get wet in the rain?
(a) Half
(b) One-fourth
(c) Three-fourth - If the number of children in the class is 28, then tell the number of children
(a) Who like to get wet in the rain?
(b) Who do not like to get wet in the rain?
| Colour of flowers | Number of flowers |
| Blue | 9 |
| Red | 7 |
| Orange | 5 |
| Purple | 10 |
Draw the right flower. Write how many there are.
 |
 |
 |
 |
______ are more than ______
Look at the traffic scene in the picture and fill in the table.
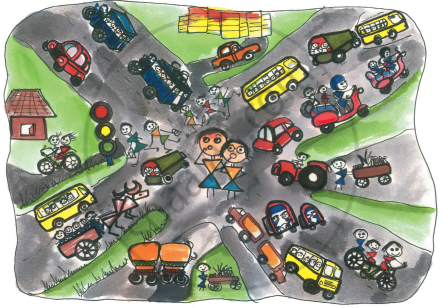
| Way of Travel | How many |
| Walking (people) | |
| Bicycles | |
| Scooters | |
Answer the following question.

The number of buses is less than the number of ______.
| Number of people living together | How many families |
| 1 alone | 2 |
| 2 people | 5 |
| 3 people | 8 |
| 4 people | 6 |
| 5 people | 4 |
| 6 people | 2 |
| 7 people | 2 |
| 8 people | 1 |
Most families have ______ people living in their homes.
| Absent Students' Chart | |
| Class | Absent student |
| Class I |   |
| Class II |  |
| Class III |    |
| Class IV |     |
| Class V |   |
Now look at the chart and fill in the blanks:
The class with 3 students absent is ______.
| Absent Students' Chart | |
| Class | Absent student |
| Class I | |
| Class II | |
| Class III | |
| Class IV | |
| Class V | |
Now look at the chart and fill in the blanks:
The number of students absent in Class IV and Class V are ______ and ______.
Make your own smart charts about things around you.
| Vegetable disliked | Number of students |
| Onion | 2 |
| Tomato | 3 |
| Brinjal | 4 |
| Ladyfinger | 2 |
| Potato | 1 |
The vegetable disliked by very few children is ______.
