Advertisements
Advertisements
प्रश्न
Use a scale and find out from your chart:
- The length of the longest strip is ______ cm.
- So, ______ has the biggest head.
- The smallest strip is ______ cm long. It belongs to ______
Advertisements
उत्तर
The strips belongs to my friend’s is head are pasted like as:
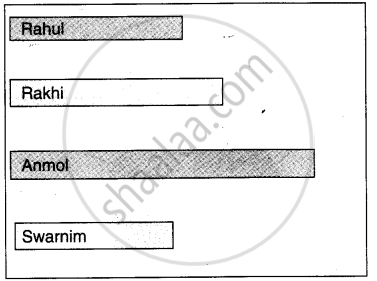
- The length of the longest strip is 55 cm.
- So, Anmol has the biggest head.
- The smallest strip is 32 cm long. It belongs to Swarnim.
APPEARS IN
संबंधित प्रश्न
- Ask people in your family to name one programme they like and one programme they dislike. Make a table.
Family member Programme they like Programme they dislike Mother Father - The kind of programme most family members like ______
- The kind of programme most family members dislike ______
Find out from 20 friends the programmes they like and dislike, and write in a table.
| Kind of programme |
Number of children liking it |
Number of children disliking it |
| News | ||
| Serials | ||
| Cartoons | ||
| Comedy shows | ||
| Sports |
- Which kind of programme is liked by most children?
- Which kind of programme is disliked by the least number of children?
- How many children like sports programmes?
- Is there any kind of programme not liked by anyone? Yes/No. If yes, which one?
Find out from your classmates and fill the table.
| Main food | Number of persons |
| Rice | |
| Wheat | |
Look at the table and tell :
- Most children eat food made from ______
- Compared to children who eat rice, those who eat wheat are more/less/equal.
- Compare to those who eat wheat, children eating ragi are more/less.
Some children were asked which of these they liked most-Tea, Coffee or Milk.
| The Drink they like | Number of children |
| Milk | 20 |
| Coffee | 10 |
| Tea | 10 |
- Total number of children ______
- Children who like milk are `1/2`/ `1/4` of the total children.
- Children who like coffee are `1/2`/`1/4` of the total children.
- Show the liking for Tea, Coffee or Milk in a Chapati Chart.
Answer the following question.
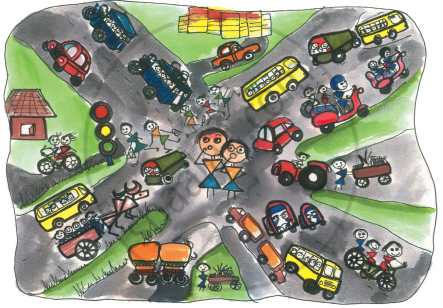
The number of buses is less than the number of ______.
| Face of the die | Number of times ( / for each throw) |
 |
| | | | | |
 |
| | | |
 |
| | | | | |
 |
| | | | |
 |
| | | | | | | |
 |
| | | | | | |
Compare your table with that of the student sitting next to you. Do you find any difference in the two tables?
|
Attendance Board Date 8/2/2007 |
|||
| Class | Number of Students | Students Present | Students absent |
| Class I | 27 | 25 | 2 |
| Class II | 23 | 22 | 1 |
| Class III | 24 | 21 | 3 |
| Class IV | 22 | 18 | 4 |
| Class V | 25 | 23 | 2 |
| Total | |||
This board shows the number of students in each class. It also shows the number of students present and absent.
How many children in all are there in the school?
|
Attendance Board Date 8/2/2007 |
|||
| Class | Number of Students | Students Present | Students absent |
| Class I | 27 | 25 | 2 |
| Class II | 23 | 22 | 1 |
| Class III | 24 | 21 | 3 |
| Class IV | 22 | 18 | 4 |
| Class V | 25 | 23 | 2 |
| Total | |||
This board shows the number of students in each class. It also shows the number of students present and absent.
How many children in all are absent on that day?
Rohan, Jacob and Geeta also measured their hands. They stuck their strips as shown.
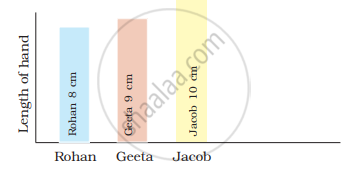
The length of Geeta's hand is ______ than Rohan's hand.
Make your own smart charts about things around you.
