Advertisements
Advertisements
प्रश्न
| Favourite sweet | Number of people |
| Jalebi | 20 |
| Rasgulla | 18 |
| Jamun | 25 |
| Laddoo | 22 |
| Burfi | 17 |
| Kalakand | 15 |
विकल्प
Kalakand and Burfi
Burfi and Laddoo
Laddoo and Jamun
Jalebi and Rasgulla
Advertisements
उत्तर
Jalebi is liked more than Rasgulla.
APPEARS IN
संबंधित प्रश्न
Some children were asked which of these they liked most-Tea, Coffee or Milk.
| The Drink they like | Number of children |
| Milk | 20 |
| Coffee | 10 |
| Tea | 10 |
- Total number of children ______
- Children who like milk are `1/2`/ `1/4` of the total children.
- Children who like coffee are `1/2`/`1/4` of the total children.
- Show the liking for Tea, Coffee or Milk in a Chapati Chart.
 |
 |
 |
 |
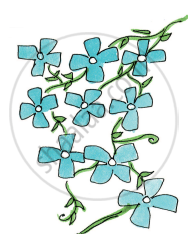
| Colour of flowers | Number of flowers |
| Blue | 9 |
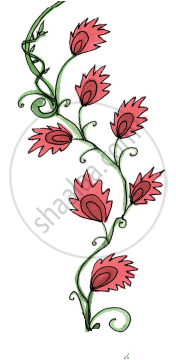
| Red | 7 |
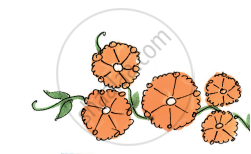
| Orange | 5 |
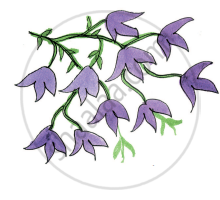
| Purple | 10 |
Draw the right flower. Write how many there are.
______ are the most in number. How many?
Answer the following question.
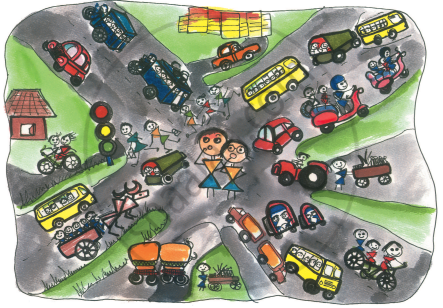
In the picture which way of travel do you see the most?
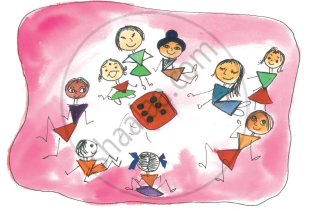
How many dots are there on the different faces of a die?
| Face of the die | Number of times ( / for each throw) |
 |
| | | | | |
 |
| | | |
 |
| | | | | |
 |
| | | | |
 |
| | | | | | | |
 |
| | | | | | |
came up more number of times than ______.
Ask your friends about the number of people living in their homes. Fill in the table.
| Number of people living together | How many families |
| 1 alone | |
| 2 people | |
| 3 people | |
| 4 people | |
| 5 people | |
| 6 people | |
| 7 people | |
| 8 people | |
| ................. |
| Food item | Number of students |
| Lemon rice | 7 |
| Meals | 12 |
| Curd rice | 5 |
| Fried rice | 3 |
| Tomato rice | 2 |
Food item brought for lunch by the biggest number of students ______.
- Make a group of 4 friends.
- Cut strips from waste paper. The strips should be of the same width.
- Measure the length of each student's hand with the paper strip. Cut the strip and write the name of the student.
Rohan, Jacob and Geeta also measured their hands. They stuck their strips as shown.
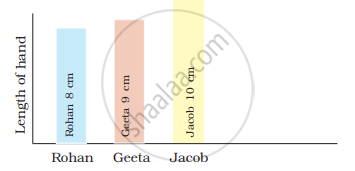
Look at the picture and fill in the blanks:
______ has the shortest hand.
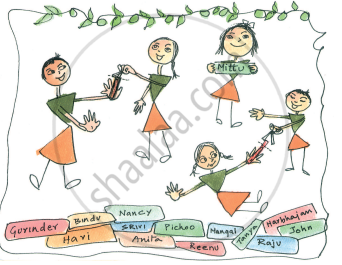
Which vegetable is most disliked? Ask your friends and complete the table.
| Vegetable disliked | Number of students |
