Advertisements
Advertisements
प्रश्न
Draw the PV diagram for the adiabatic process.
Advertisements
उत्तर

APPEARS IN
संबंधित प्रश्न
A thermodynamic system is taken from an original state to an intermediate state by the linear process shown in Figure
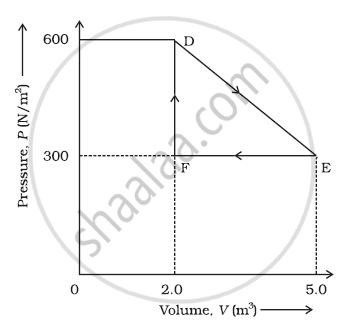
Its volume is then reduced to the original value from E to F by an isobaric process. Calculate the total work done by the gas from D to E to F
Draw a p-V diagram showing positive work at constant pressure.
State the assumptions made for thermodynamic processes.
Write a note on free expansion.
In an isochoric process, we have ____________.
Derive the work done in an adiabatic process.
Explain the isobaric process and derive the work done in this process.
In an adiabatic expansion of the air, the volume is increased by 4%, what is the percentage change in pressure? (For air γ = 1.4)
Two identical samples of a gas are allowed to expand (i) isothermally (ii) adiabatically. Work done is ____________.
In the figure shown here, the work done in the process ACBA is ______.

