Advertisements
Advertisements
प्रश्न
Draw the graph of the lines y = x + 2, y = 2x - 1 and y = 2 from x = -3 to 4, on the same graph paper. Check whether the lines drawn are parallel to each other.
Advertisements
उत्तर
For,
y = x + 2
When x = 0, y = 0 + 2 = 2
When x = 5, y = 5 + 2 = 7
When x = -3, y = -3 + 2 = -1
| x | 0 | 5 | -3 |
| y | 2 | 7 | -1 |
For,
y = 2x - 1
When x = 0, y = 2(0) -1 = -1
When x = -2, y = 2(-2) -1 = -5
When x = 3, y = 2(3) -1 = 5
| x | 0 | -2 | 3 |
| y | -1 | -5 | 5 |
For,
y = 2
This line is parallel to the x-axis and passes through (0, 2)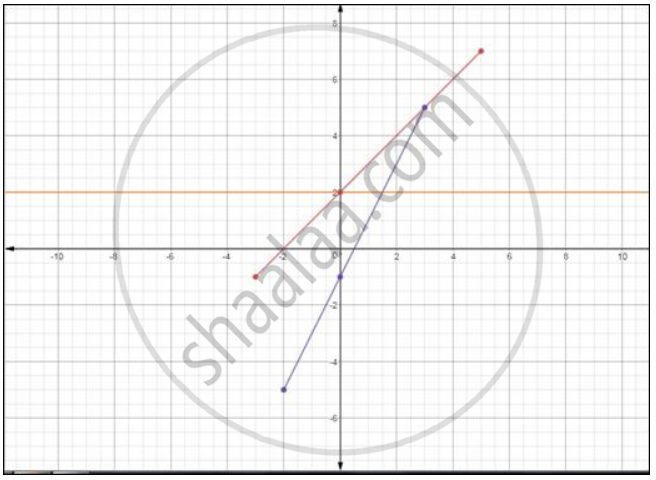
The lines are not parallel to each other.
APPEARS IN
संबंधित प्रश्न
Draw the graph of the equation given below.
x + y = 2
The following table gives production yield in kg per hectare of wheat of 100 farms of a village:
| Production yield (kg/hectare): |
40 – 45 | 45 – 50 | 50 – 55 | 55 – 60 | 60 – 65 | 65 – 70 |
| Number of farms | 4 | 6 | 16 | 20 | 30 | 24 |
Change the distribution to 'a more than' type distribution, and draw its ogive.
Draw the graph for the linear equation given below:
y = - x + 4
Draw the graph for the equation given below:
`(1)/(2) x + (2)/(3) y = 5`.
The graph of 3x + 2y = 6 meets the x=axis at point P and the y-axis at point Q. Use the graphical method to find the co-ordinates of points P and Q.
Draw the graph of equation x + 2y - 3 = 0. From the graph, find:
(i) x1, the value of x, when y = 3
(ii) x2, the value of x, when y = - 2.
Draw a graph of each of the following equations: y = `(5)/(2) xx + (2)/(5)`
Draw a graph for each of the following equations and find the coordinates of the points where the line drawn meets the x-axis and y-axis: `(2x)/(5) + y/(2)` = 1
Draw the graph of the lines represented by the equations 2x - y = 8 and 4x + 3y = 6 on the same graph. Find the co-ordinates of the point where they intersect.
Draw the graph of the lines represented by the equations 5y = 3x + 1 and y = 2x + 3 on the same graph. Find the coordinates of the point where they intersect.
