Advertisements
Advertisements
प्रश्न
Between India and Brazil, whose per capita income is less?
Advertisements
उत्तर
Between India and Brazil, India’s per capita income is less.
संबंधित प्रश्न
Select the correct option and rewrite the sentence:
------------ is seen as one of the world’s major markets and contributor to economic growth of the world.
Draw a suitable Line graph with the help of the following statistical information and answer the following questions.
| Number of international tourists (in lakhs) | |||||
| International tourists (in lakhs) |
1995 | 2000 | 2005 | 2010 | 2015 |
| Brazil | 20 | 50 | 45 | 40 | 50 |
| India | 20 | 21 | 30 | 50 | 140 |
- In which year is the number of tourists maximum in India?
- In the year 2000, how many tourists visited Brazil?
- In which year do India and Brazil have the same number of international tourists?
State whether the sentence is right or wrong and correct the wrong ones and rewrite the sentence
Like the Indian economy, the Brazilian economy is also of mixed type.
The economies of India and Brazil are of the ______ type.
Give geographical reasons.
Per capita land availability is more in Brazil as compared to India.
Read the following graph and answer the questions:
Gross National Incomes (GNI) from 1960 to 2016 (in million US $)
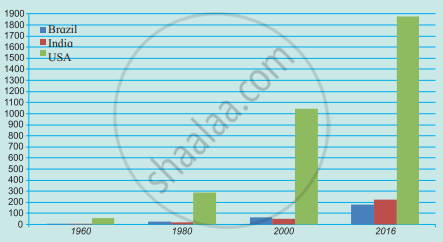
- Which country’s national income was highest in 2016 and was it how much?
- Comparing India and Brazil, which country had a higher national income in 1980?
- Comparing India and Brazil, which country had a higher income in 2016?
- Tell the difference between the GNP of Brazil and India in 2016.
- Calculate the difference between the national incomes of developed and developing countries in 2016.
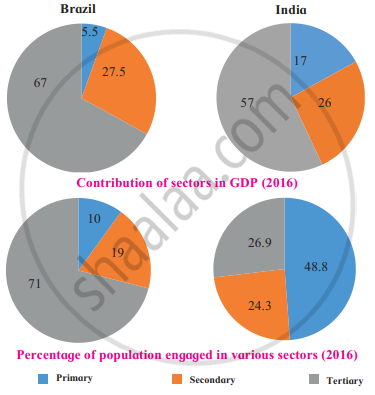
With the help of the pie chart given in the fig., tell what the contribution of secondary activities is to Brazil’s GDP?
Write answer in one sentence-
Which type of economy is found in Brazil?
Observe the following graph and answer the questions given below-

- Which country has a higher percent of the population engaged in primary activities?
- In which country is the contribution of tertiary sector greater in the GDP?
- In which country is the share of secondary activities more in the GDP?
- Can we say that Brazil is an agrarian economy like India? Give reasons.
- Which country has a higher percent of the population engaged in secondary activities?
- How much percent of population is engaged in tertiary activities in India?
Read the following graph and answer the questions:
India and Brazil Contribution of sectors in national income and percentage of population engaged in the sector.

- Name the sectors mentioned in the graph.
- Which sector contributes the highest in National income in India?
- How much percent of population is engaged in primary sector in Brasil?
