Advertisements
Advertisements
Question
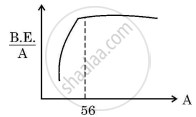
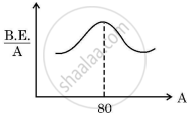
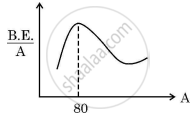
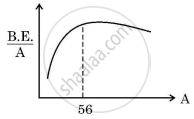
Which of the following figures correctly represent the shape of curve of binding energy per nucleon as a function of mass number?
Options
MCQ
Advertisements
Solution
Explanation:
The graph of binding energy per nucleon as a function of mass number has a peak at iron (Fe, mass 56). This is because the binding energy per nucleon rises with mass number up to iron, then falls for heavier elements.
shaalaa.com
Is there an error in this question or solution?
