Advertisements
Advertisements
Question
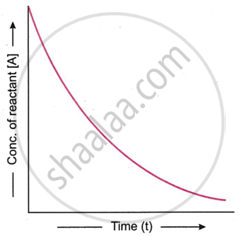
What is the graphical behaviour of a first order reaction on plotting [A] against t?
Graph
Short Answer
Advertisements
Solution
We know that
[A] = [A]0e−kt
According to this equation, a first-order process is exponential, and the reactant concentration drops exponentially over time. Therefore, an exponential decay curve is produced when a graph is plotted between the reactant concentrations at various points in time.
shaalaa.com
Is there an error in this question or solution?
