Advertisements
Advertisements
Question
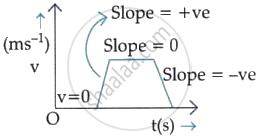
The velocity (v)-time (t) plot of the motion of a body is shown below:
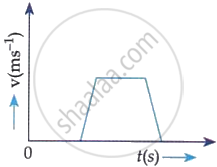
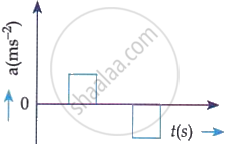
The acceleration (a)-time (t) graph that best suits this motion is:
Options
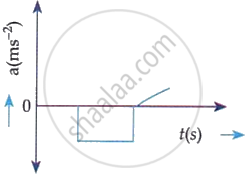
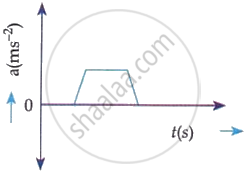
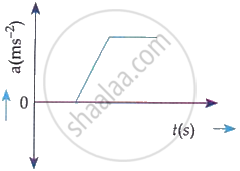
MCQ
Advertisements
Solution
Explanation:
shaalaa.com
Is there an error in this question or solution?
