Advertisements
Advertisements
Question
The monthly income of a group of 320 employees in a company is given below:
| Monthly Income | No. of Employees |
| 6000-7000 | 20 |
| 7000-8000 | 45 |
| 8000-9000 | 65 |
| 9000-10000 | 95 |
| 10000-11000 | 60 |
| 11000-12000 | 30 |
| 12000-13000 | 5 |
Draw an ogive the given distribution on a graph sheet taking 2 cm = Rs. 1000 on one axis and 2 cm = 50 employees on the other axis. From the graph determine:
(1) the median wage
(2) the number of employees whose income is below Rs. 8500.
(3) if the salary of a senior employee is above Rs. 11,500, find the number of senior employees in the company.
(4) the upper quartile.
Advertisements
Solution 1
| Monthly Income | No. of Employees | c.f. |
| 6000-7000 | 20 | 20 |
| 7000-8000 | 45 | 65 |
| 8000-9000 | 65 | 130 |
| 9000-10000 | 95 | 225 |
| 10000-11000 | 60 | 285 |
| 11000-12000 | 30 | 315 |
| 12000-13000 | 5 | 320 |
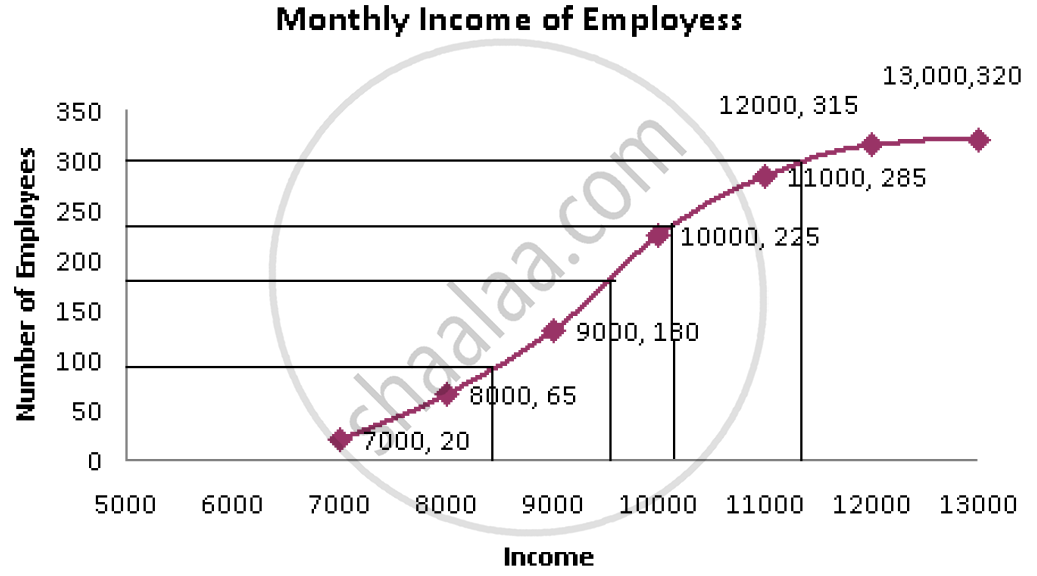
Here, n = 320
1) Media = `n/2` th term = 160 th term
From the graph, the corresponding x coordinate is 9400
median wage = 9400 approx
2) The number of employees whose income is below Rs. 8500 = 95 (approx.)
3) The number of senior employees whose salary is above Rs. 11500 = 320 – 305 = 15 (approx.)
4) The upper quartile `Q_3 = ((3n)/4)^"th"` term = 240 th term
From the graph, the corresponding x co-ordinate is 10,300 (approx.)
Solution 2
| Monthly | No. of Employees | c.f. |
| 6000 - 7000 | 20 | 20 |
| 7000 - 8000 | 45 | 65 |
| 8000 - 9000 | 65 | 130 |
| 9000 - 10000 | 95 | 225 |
| 10000 - 11000 | 60 | 285 |
| 11000 - 12000 | 30 | 315 |
| 12000 - 13000 | 5 | 320 |
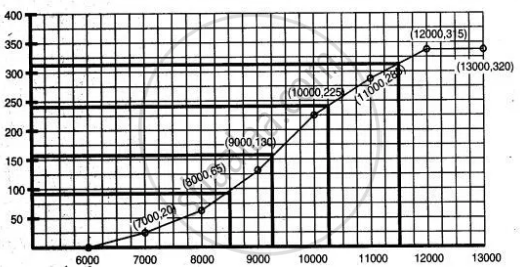
(i) From the graph, the median wage = 160·5 (appro.)
(ii) The number of employees whose income is below ₹8500 = 90 (appro.)
(iii) The number of senior employees whose salary is above ₹ 11500 = 20 (appro.)
(iv) The upper quartile Q3 = 240 (appro.)
