Advertisements
Advertisements
Question
The marks obtained by 100 students of a class in an examination are given below.
| Mark | No. of Student |
| 0 - 5 | 2 |
| 5 - 10 | 5 |
| 10 - 15 | 6 |
| 15 - 20 | 8 |
| 20 - 25 | 10 |
| 25 - 30 | 25 |
| 30 - 35 | 20 |
| 35 - 40 | 18 |
| 40 - 45 | 4 |
| 45 - 50 | 2 |
Draw 'a less than' type cumulative frequency curves (ogive). Hence find the median.
Graph
Sum
Advertisements
Solution
We first prepare the cumulative frequency table by less than method as given below–
| Marks | No. of students | Marks less than | Cumulative Frequency |
| 0 - 5 | 2 | 5 | 2 |
| 5 - 10 | 5 | 10 | 7 |
| 10 - 15 | 6 | 15 | 13 |
| 15 - 20 | 8 | 20 | 21 |
| 20 - 25 | 10 | 25 | 31 |
| 25 - 30 | 25 | 30 | 56 |
| 30 - 35 | 20 | 35 | 76 |
| 35 - 40 | 18 | 40 | 94 |
| 40 - 45 | 4 | 45 | 98 |
| 45 - 50 | 2 | 50 | 100 |
Thus we will plot the points (5, 2), (10, 7), (15, 13), (20, 21), (25, 31), (30, 56), (35, 76), (40, 94), (45, 98) and (50, 100).
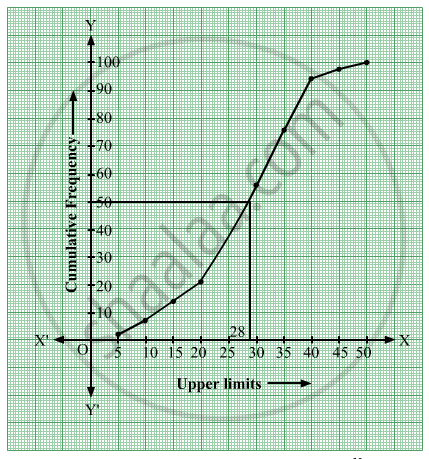
∴ From the above ogive, the horizontal line drawn from `("N")/(2)=50` intersects the ogive at a point whose x-coordinate is approximately 28.
∴ Hence, Median≈">≈28.
shaalaa.com
Is there an error in this question or solution?
