Advertisements
Advertisements
Question
The graph given below represents a cooling curve fore a substance being cooled from a higher temperature to a lower temperature.
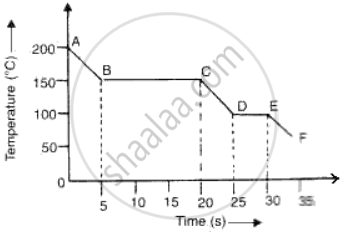
(a)What is the boiling point of the substance?
(b)What happens in the region DE?
(c)What is the melting point of the substance?
Graph
Short/Brief Note
Advertisements
Solution
(a)Boiling point of substance is 150°C (because the part BC represents condensation where the vapour changes into liquid without the change in temperature.
(b)DE represents freezing of the substance where the liquid changes into solid at a constant temperature of 100°C.
(c)Melting point is the temperature of the region DE where liquid changes into solid i.e., 100°C.
shaalaa.com
Is there an error in this question or solution?
