Advertisements
Advertisements
Question
The given graph shows the trend of exports and imports (in Rs. Crores) over the years 2013-14 to 2021-22.
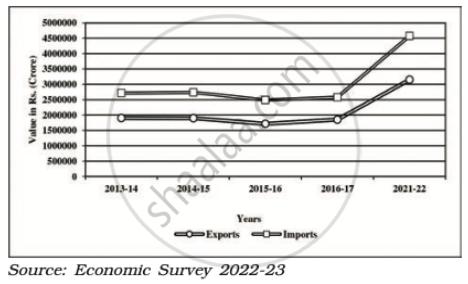
Based on the graph, which of the following statements is correct?
Options
Imports consistently increased from 2013-14 to 2021-22.
Exports and imports were nearly equal in 2016-17.
There was no significant change in exports between 2013-14 and 2016-17.
Exports showed a sharper increase compared to imports 2016- 17 and 2021-22.
MCQ
Advertisements
Solution
There was no significant change in exports between 2013-14 and 2016-17.
Explanation:
Between 2013–14 and 2016–17, the export line on the graph remains nearly flat, showing only slight fluctuations. This indicates that exports did not undergo any significant rise or fall during this period,
shaalaa.com
Is there an error in this question or solution?
