Advertisements
Advertisements
Question
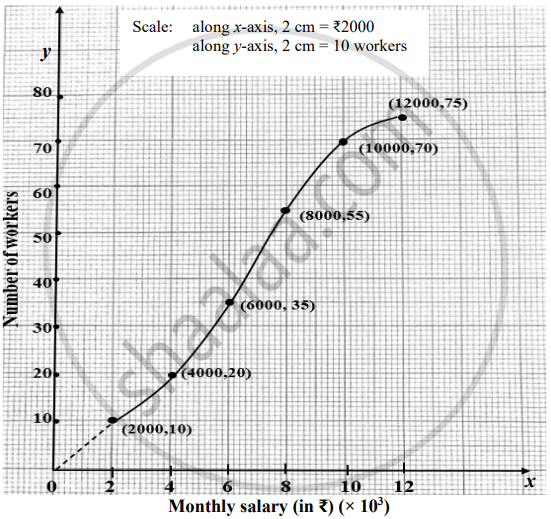
The given graph represents the monthly salaries (in ₹) of workers of a factory.
Using graph answer the following:
- the total number of workers.
- the median class.
- the lower-quartile class.
- number of workers having monthly salary more than or equal to ₹6,000 but less than ₹10,000.
Advertisements
Solution
(a) The highest point is at 75 workers. Hence, the total number of workers is 75.
(b) Since, n = 75 (odd)
`"Median" = ((n + 1)/2)^(th) "observation"`
= `((75 + 1)/2)^(th) "observation"`
= 38th observation
The cumulative frequency reaches 35 at ₹6,000 and 55 at ₹8,000.
Therefore, the median class is ₹6,000 to ₹8,000
(c) The lower-quartle class = `((n + 1)/4)^(th) "observation"`
=`((75 + 1)/4)^(th) "observation"`
= 19th observation
The cumulative frequency reaches 20 at ₹4,000. Therefore, the lower-quartile class is ₹2,000 to 4,000.
(d) At ₹6,000 there are 35 workers and at 10,000 there are 70 workers.
Therefore, the number of workers in this salary range 70 − 35 = 35.
