Advertisements
Advertisements
Question
The following information relate to Shailja Ltd. for the years ending March 31, 2023, and 2022.
| March 31, 2023 (₹) |
March 31, 2023 (₹) |
|
| Revenue from Operations | 48,00,000 | 40,00,000 |
| Less: Cost of Revenue from Operations | 37,44,000 | 32,00,000 |
| Gross Profit | 10,56,000 | 8,00,000 |
| Less: Operating Exp. | ||
| Administrative and Selling Exp. | (3,00,000) | (2,50,000) |
| Depreciation on Plant & Machinery | (2,80,000) | (2,24,000) |
| Operating Income | 4,76,000 | 3,26,000 |
| Less: Other Exp. (Interest on Debentures) | 90,000 | 75,600 |
| Net Income Before Tax | 3,86,000 | 2,50,400 |
| Less: Provision for Tax | 56,000 | 36,000 |
| Net Income after Tax | 3,30,000 | 2,14,400 |
| SHAILJA LIMITED | |||||
| BALANCE SHEETS as at March 31st, 2023 and 2022 | |||||
| Note No. |
March 31 | ||||
| 2023 (₹) | 2022 (₹) | ||||
| I. | Equity & Liabilities | ||||
| (1) | Shareholder’s Funds | ||||
| Equity Share Capital | 1 | 14,20,000 | 10,00,000 | ||
| Reserves & Surplus | 11,10,000 | 7,76,000 | |||
| (2) | Non-Current Liabilities | ||||
| Long-Term Borrowings | 2 | 15,00,000 | 13,40,000 | ||
| (3) | Current Liabilities | ||||
| Trade Payables | 10,64,000 | 9,64,000 | |||
| Short-term Provision | 3 | 56,000 | 36,000 | ||
| 51,50,000 | 41,16,000 | ||||
| II. | Assets | ||||
| (1) | Non-Current Assets | ||||
| (a) Property, Plant and Equipment and Intangible Assets | |||||
| (i) Property, Plant and Equipment (Machinery) | 24,50,000 | 24,16,000 | |||
| (b) Non-Current Investments | 3,00,000 | 1,00,000 | |||
| (2) | Current Assets | ||||
| Inventory | 11,00,000 | 7,20,000 | |||
| Trade Receivables | 12,00,000 | 8,00,000 | |||
| Cash and Bank Balance | 1,00,000 | 80,000 | |||
| 51,50,000 | 41,16,000 | ||||
Notes to Accounts:
- Face Value of Company’s Equity Share is 10.
-
2023 (₹) 2022 (₹) Long-term Borrowings 9% Debentures 15,00,000 13,40,000 -
2023 (₹) 2022 (₹) Short-term Provision: Income Tax Provision 56,000 36,000
You are required to prepare a project report commenting upon the performance and financial position of the firm on the basis of ratio analysis.
Advertisements
Solution
Introduction of the Project:
The project work is to make observations on the performance and financial position of the company on the basis of information for two years.
Figures for two years are given and are used for the purpose of the project.
The project work is planned and executed by calculating the following ratios: (a) Liquidity Ratios, (b) Solvency Ratios, (c) Activity Ratios, and (d) Profitability Ratios.
(a) Liquidity Ratio:
`bb"Current Ratio"bb:"Current Assets"/"Current Liabilities"`
`"Year 2022":(16,00,000)/(10,00,000)=1.6:1`
`"Year 2023":(24,00,000)/(11,20,000)=2.14:1`
`bb"Quick Ratio"bb:"Liquid Assets"/"Quick Liabilities"`
`"Year 2022":(8,80,000)/(10,00,000)=0.88:1`
`"Year 2023":(13,00,000)/(11,20,000)=1.16:1`
GRAPH 1. SHOWING CURRENT RATIO: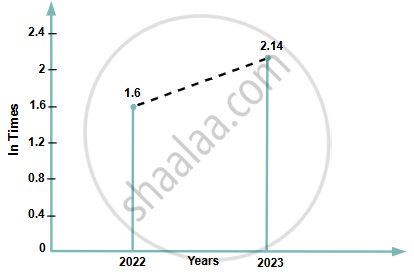
GRAPH 2. SHOWING QUICK RATIO: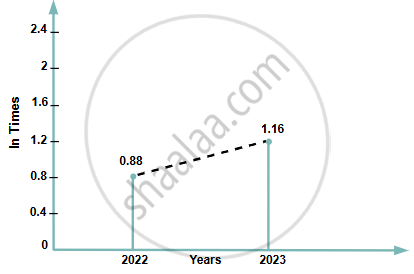
Comments: Short-term financial position of the company is quite satisfactory because the current ratio of the company is 2.14:1, which is more than the ideal ratio of 2:1. The fact is also supported by the quick ratio, which is more than the ideal ratio of 1:1.
(b) Solvency Ratios:
`bb"Debt Equity Ratio"bb:"Long term Debts"/"Shareholders’ Funds"`
`"Year 2022"=(13,40,000)/(10,00,000+7,76,000)=0.75:1`
`"Year 2023"=(15,00,000)/(14,20,000+11,10,000)=0.59: 1`
`bb"Debt to Total Assets Ratio"bb:"Long term Debts"/"Total Assets"`
`"Year 2022"=(13,40,000)/(41,16,000)=0.33:1`
`"Year 2023"=(15,00,000)/(51,50,000)=0.29:1`
GRAPH 3. SHOWING DEBT EQUITY RATIO: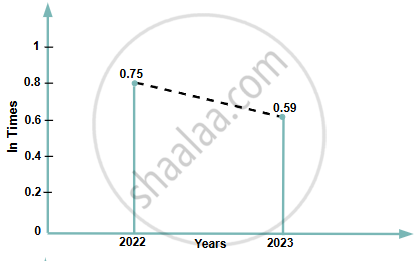
GRAPH 4. SHOWING DEBT TO TOTAL ASSETS RATIO: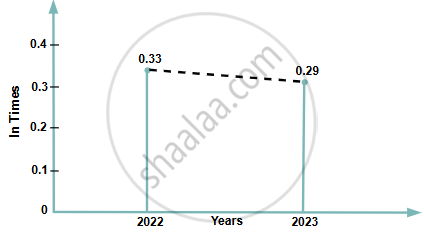
Comments: The Debt equity ratio indicates that the proportion of funds provided by long-term lenders compared to the funds provided by the owners is only 0.75 in the year 2022. This proportion has further come down to 0.59 in 2023. It shows that the company’s long-term solvency position is very sound.
The fact is also supported by the debt-to-total assets ratio. It indicates that long-term debts are 0.33 in the year 2022, and this has further decreased to 0.29 times in the year 2023.
(c) Activity Ratio:
`bb"Inventory Turnover Ratio"="Cost of Revenue from Operations"/"Average Inventory"`
`"Year 2022"=(32,00,000)/(7,20,000)=0.33:1`
Year 2023: Closing Inventory of 2022 will be treated as the Opening Inventory of 2023.
Hence,
`"Average Inventory"=(7,20,000+11,00,000)/2=9,10,000`
`"Inventory Turnover Ratio"=(37,44,000)/(9,10,000)=4.11 "times"`
`bb"Trade Receivables Turnover Ratio"="Revenue from Operations"/"Average Trade Receivables"`
`"Year 2022"=(40,00,000)/(8,00,000)=5 "times"`
Year 2023: Closing Trade Receivables of 2022 will be treated as the Opening Trade Receivables of 2023.
Hence,
`"Average Trade Receivables"=(8,00,000+12,00,000)/2=10,00,000`
`"Trade Receivables Turnover Ratio"=(48,00,000)/(10,00,000)=4.8 "times"`
`bb"Working Capital Turnover Ratio"="Revenue from Operations"/"Working Capital"`
`"Year 2022"=(40,00,000)/(6,00,000)=6.67 "times"`
`"Year 2023"=(48,00,000)/(12,80,000)=3.75 "times"`
Comments: The Inventory turnover ratio has dropped. It indicates that the company is not rapidly turning the Inventory into sales. Unsaleable items have been purchased and are included in the company’s inventory.
The Trade Receivables turnover ratio has declined. It indicates that the company’s policy regarding the collection of Trade Receivables and the selection of customers for credit sales purposes is not sound.
Working capital turnover ratio has also declined. It indicates the underutilization of working capital to generate sales.
GRAPH 5. SHOWING INVENTORY TURNOVER RATIO: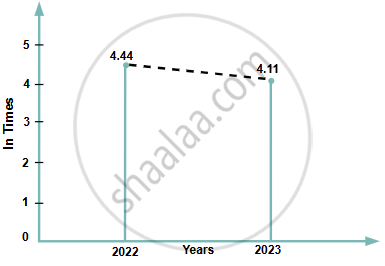
GRAPH 6. SHOWING TRADE RECEIVABLES TURNOVER RATIO: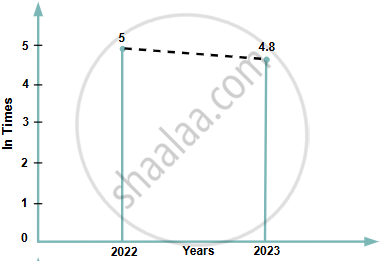
GRAPH 7. SHOWING WORKING CAPITAL TURNOVER RATIO: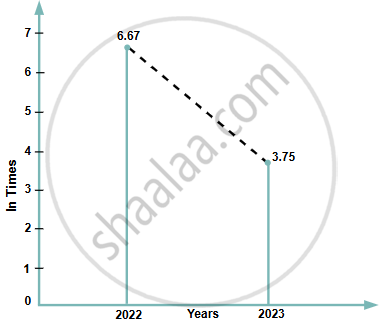
(d) Profitability Ratios:
`bb"Gross Profit Ratio"="Gross Profit"/"Revenue from Operation"xx100`
`"Year 2022"=(8,00,000)/(40,00,000)xx100=20%`
`"Year 2022"=(8,00,000)/(40,00,000)xx100=20%`
`bb"Operating Ratio"="Cost of Revenue from Operations + Operating Exp."/"Revenue from Operation"xx100`
`"Year 2022"=(32,00,000+2,50,000+2,24,000)/(40,00,000)xx100=91.85%`
`"Year 2023"=(37,44,000+3,00,000+2,28,000)/(48,00,000)xx100=90.08%`
`bb"Net Profit Ratio"="Net Profit"/"Revenue from Operation"xx100`
`"Year 2022"=(2,14,000)/(40,00,000)xx100=5.36%`
`"Year 2023"=(3,30,000)/(48,00,000)xx100=6.88%`
`bb"Earning Per Share (E.P.S.)"="Net Profit after Tax"/"No. of Equity Shares"`
`"For 2022"=(2,14,000)/(1,00,000)=2.14 "per share"`
`"For 2023"=(3,30,000)/(1,42,000)=2.32 "per share"`
GRAPH 8. SHOWING GROSS PROFIT RATIO: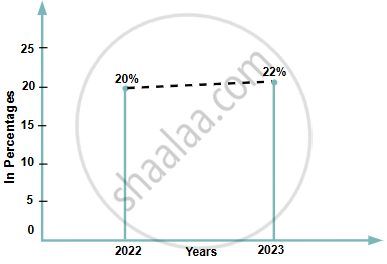
GRAPH 9. SHOWING OPERATING RATIO: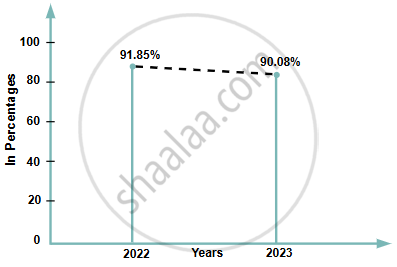
GRAPH 10. SHOWING NET PROFIT RATIO: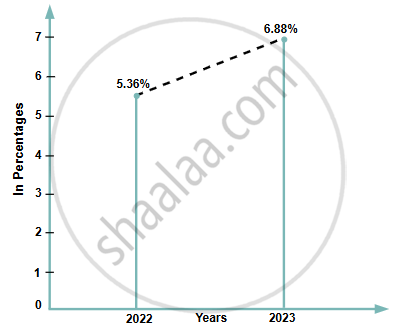
GRAPH 11. SHOWING EARNING PER SHARE (E.P.S.):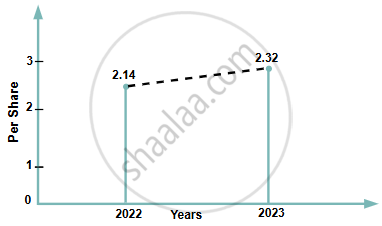
Comments: Gross Profit Ratio has improved by 2%, which reflects an increase in the sale price of goods sold without a corresponding increase in sales costs.
The operating ratio has also come down by 2%. Lowering of the operating ratio has resulted in a higher margin of profit on sales.
Net Profit ratio has gone up from 5.36% to 6.88% which is an indication of improvement in the overall efficiency and profitability of the firm.
Earnings per share (EPS) have also gone up from 2.14 to 2.32, which indicates that the overall profitability of the company is improving. This ratio also indicates that the market price of this company’s shares is likely to go up.
Conclusion: Overall profitability and financial position of Shailja Ltd. have improved in the year 2023.
