Advertisements
Advertisements
Question
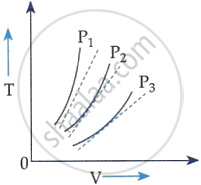
The following graph represents the T-V curves of an ideal gas (where T is the temperature and V the volume) at three pressures P1, P2 and P3 compared with those of Charles’s law represented as dotted lines.
Options
P2 > P1 > P3
P1 > P2 > P3
P3 > P2 > P1
P1 > P3 > P2
MCQ
Advertisements
Solution
P1 > P2 > P3
Explanation:
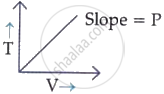
From an ideal gas equation:
PV = nRT
⇒ T = `(P/(n R)) V`
i.e. T ∝ V and slope will be `P/(n R)`.
So,
P1 > P2 > P3
shaalaa.com
Is there an error in this question or solution?
