Advertisements
Advertisements
Question
The following distribution gives the daily income of 50 workers of a factory.
| Daily income (in Rs | 100 − 120 | 120 − 140 | 140 − 160 | 160 − 180 | 180 − 200 |
| Number of workers | 12 | 14 | 8 | 6 | 10 |
Convert the distribution above to a less than type cumulative frequency distribution, and draw its ogive.
Advertisements
Solution
The frequency distribution table of less than type is as follows
|
Daily income (in Rs) (upper class limits) |
Cumulative frequency |
| Less than 120 | 12 |
| Less than 140 | 12 + 14 = 26 |
| Less than 160 | 26 + 8 = 34 |
| Less than 180 | 34 + 6 = 40 |
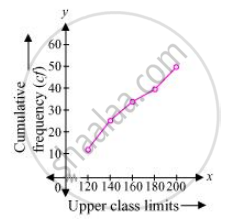
| Less than 200 | 40 + 10 = 50 |
Taking upper class limits of class intervals on x-axis and their respective frequencies on y-axis, its ogive can be drawn as follows.
shaalaa.com
Is there an error in this question or solution?
