Advertisements
Advertisements
Question
The daily wages of 160 workers in a building project are given below:
| Wages in ₹ | 0 - 10 | 10 - 20 | 20 - 30 | 30 - 40 | 40 - 50 | 50 - 60 | 60 - 70 | 70 - 80 |
| No. of Workers | 12 | 20 | 30 | 38 | 24 | 16 | 12 | 8 |
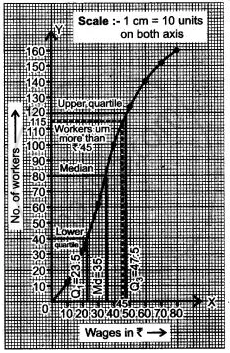
Using a graph paper, draw in Ogive for the above distribution.
Use your Ogive to estimate :
(i) the median wage of the workers.
(ii) the upper quartile wage of the workers
(iii) the lower quartile wages of the workers
(iv) the percentage of workers who earn more than ₹ 45 a day.
Advertisements
Solution
| Wages (in ₹) | No. of Workers | Cummulative frequency |
| 0 - 10 | 12 | 12 |
| 10 - 20 | 20 | 32 |
| 20 - 30 | 30 | 62 |
| 30 - 40 | 38 | 100 |
| 40 - 50 | 24 | 124 |
| 50 - 60 | 16 | 140 |
| 60 - 70 | 12 | 152 |
| 70 - 80 | 8 | 160 |
(i) Median = `("n"/2)^"th"` observation
= `(160/2)^"th"` observation
= 80th observation
Now the 80th position in the ogive diagram represent the median wage of workers by the graph = 35.
(ii) Upper quartile = `((3"n")/(4))^"th"` observation
= `((3 xx 160)/(4))^"th"` observation
= 120th observation
(iii) Lower quartile = `("n"/4)^"th"` observation
= `(160/4)^"th"` observation
40th observation
The 40th observation in the ogive diagram represents wage of the workers Q1 = 23·5
(iv) The percentage of workers earmore than ₹45
= `(160 - 115)/(100) xx 100`
= `(45 xx 10)/(16)`
= 28·125%.
