Advertisements
Advertisements
Question
Study the population growth curves in the graph given ahead and answer the questions which follow:
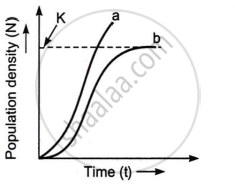
- Identify the growth curves ‘a’ and ‘b’.
- Which one of them is considered a more realistic one, and why?
- If `(dN)/dt = rN ((K - N)/K)` is the equation of the logistic growth curve, what does K stand for?
- What is symbolised by N?
- Mention the conditions responsible for the curves ‘a’ and ‘b’ respectively.
Long Answer
Advertisements
Solution
- The growth curves ‘a’ and ‘b’ represent exponential and logistic population growth, respectively.
- Curve ‘b’ (logistic growth) is more realistic because it considers environmental limits on population growth, showing a steady population size near carrying capacity.
- In the logistic growth equation `(dN)/dt = rN ((K - N)/K)`, (K) stands for the carrying capacity, which is the maximum population size that the environment can sustain.
- (N) symbolizes the population size or population density at a given time.
- Curve ‘a’ (exponential growth) occurs when resources are unlimited, leading to a rapid population increase. Curve ‘b’ (logistic growth) occurs under limited resources, where population growth slows as it reaches the carrying capacity.
shaalaa.com
Is there an error in this question or solution?
