Advertisements
Advertisements
Question
| Price (in ₹) | QA (units) | QB (units) | QM (market demand)(units) |
| 10 | 4 | 5 | ______ |
| 20 | 3 | 4 | ______ |
| 30 | 2 | 3 | ______ |
| 40 | 1 | 2 | ______ |
Complete the above schedule and answer the following:
- Identify and state the underlying law.
- State four assumptions of the law.
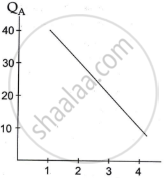
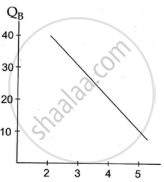
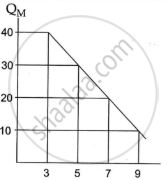
- Draw three relevant curves based on the above schedule in one diagram.
Long Answer
Advertisements
Solution
| Price (in ₹) | QA (units) | QB (units) | QM (market demand)(units) |
| 10 | 4 | 5 | 9 |
| 20 | 3 | 4 | 7 |
| 30 | 2 | 3 | 5 |
| 40 | 1 | 2 | 3 |
- The above schedule demonstrates the law of demand. According to the law of demand, increasing the price of a commodity leads to decreased demand and vice-versa provided other parameters stay unchanged.
- Assumptions of the law of demand are:
- The price of related commodities, such as substitutes or complementary goods, remains constant.
- The consumer's expectations remain unchanged.
- Consumer income levels remain stable.
- Consumer tastes and preferences remain stable.
shaalaa.com
Is there an error in this question or solution?
