Advertisements
Advertisements
Question
Percentage of the different products of a village in a particular district are given below. Draw a pie-chart representing this information.
| Items | Wheat | Pulses | Jwar | Grounnuts | Vegetables | Total |
| % | `125/3` | `125/6` | `25/2` | `50/3` | `25/3` | 100 |
Advertisements
Solution
We know:
Central angle of a component = (component value/sum of component values x 360ο)
Here, the total % of items = 100
Thus, the central angle for each component can be calculated as follows:
| Item | In % | Sector angle | |
| Wheat | 125/3 | 41.66 | 41.66/100 x 360 = 149.97 |
| Pulses | 125/6 | 20.83 | 20.83/100 x 360 = 74.98 |
| Jwar | 25/2 | 12.5 | 12.5/100 x 360 = 45 |
| Groundnuts | 50/3 | 16.66 | 16.66/100 x 360 = 59.97 |
| Vegetables | 25/3 | 8.33 | 8.33/100 x 360 = 29.98 |
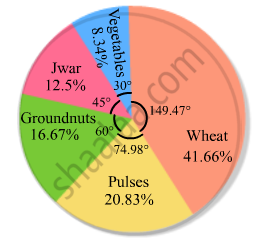
Now, the pie chat representing the given data can be constructed by following the steps below:
Step 1 : Draw circle of an appropriate radius.
Step 2 : Draw a vertical radius of the circle drawn in step 1.
Step 3 : Choose the largest central angle. Here the largest central angle is 149.97o. Draw a sector with the central angle 149.97o in such a way that one of its radii coincides with the radius drawn in step 2 and another radius is in its counter clockwise direction.
Step 4 : Construct other sectors representing other items in the clockwise sense in descending order of magnitudes of their central angles.
Step 5 : Shade the sectors with different colours and label them, as shown as in the figure below.