Advertisements
Advertisements
Question
Observe the graph showing the behaviour of water in Hope’s apparatus and answer the following questions.
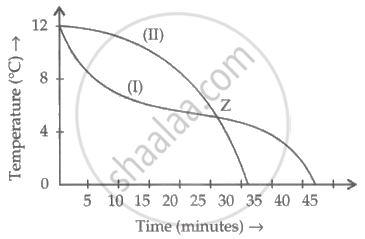
- Graph is plotted for two thermometers for which temperature range water displays anomalous behaviour.
- What does point Z in the above graph denote?
Short/Brief Note
Advertisements
Solution
- 0°C to 4°C
- The temperature at which water has its highest density is designated as Point Z.
shaalaa.com
Is there an error in this question or solution?
