Advertisements
Advertisements
Question
From the choices given below, choose the equation whose graphs are given in the given figures.
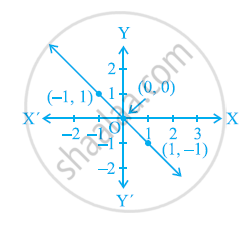
For the first figure
(i) y = x
(ii) x + y = 0
(iii) y = 2x
(iv) 2 + 3y = 7x
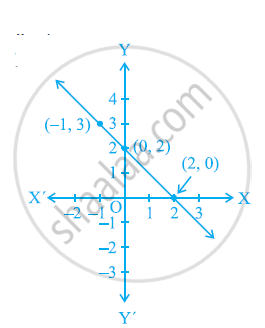
For the second figure
(i) y = x +2
(ii) y = x − 2
(iii) y = − x + 2
(iv) x + 2y = 6
Advertisements
Solution
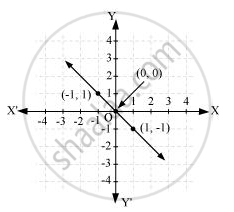
Points on the given line are (−1, 1), (0, 0), and (1, −1).
It can be observed that the coordinates of the points of the graph satisfy the equation x + y = 0. Therefore, x + y = 0 is the equation corresponding to the graph as shown in the first figure.
Hence, (ii) is the correct answer.
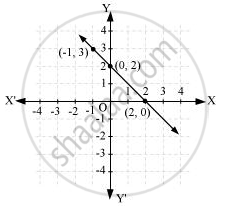
Points on the given line are (−1, 3), (0, 2), and (2, 0). It can be observed that the coordinates of the points of the graph satisfy the equation y = − x + 2.
Therefore, y = − x + 2 is the equation corresponding to the graph shown in the second figure.
Hence, (iii) is the correct answer.
