Advertisements
Advertisements
Questions
Explain through a diagram the effect of a rightward shift of both the demand and supply curves on equilibrium price and quantity.
With the help of a diagram, show how the equilibrium price can remain unchanged even after a rightward shift of the demand curve.
Diagram
Explain
Very Long Answer
Advertisements
Solution
(a) When Demand and Supply Increase in the Same Proportion:

- Let the initial equilibrium be at point E1, where the original demand curve (D1D1) and supply curve (S1S1) intersect.
- The initial equilibrium price is P1 and the quantity is q1.
- Suppose both demand and supply increase by the same proportion:
- Demand curve shifts to D2D2.
- Supply curve shifts to S2S2.
- The new curves intersect at point E2 with
- Same price: P1 (unchanged)
- Higher quantity: q2 (increased)
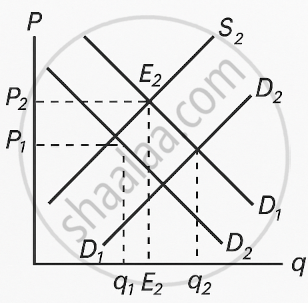
(b) When Demand Increases More Than the Increase in Supply:

- Initial equilibrium is at point E1 with price P1 and quantity q1.
- Demand increases more than supply.
- Demand curve shifts to D2D2.
- Supply curve shifts to S2S2.
- New equilibrium is at point E₂, where:
- Price rises to P2
- Quantity increases to q2
(c) When the Increase in Demand is Less Than the Increase in Supply:
- Initial equilibrium is at point E1 with price P1 and quantity q1.
- Supply increases more than demand.
- Demand curve shifts to D2D2.
- Supply curve shifts to S2S2.
- The new intersection point is E2, leading to
- Lower price: P2
- Higher output: q2
shaalaa.com
Is there an error in this question or solution?
