Advertisements
Advertisements
Questions
Explain how the equilibrium price can be determined with the help of demand and supply curves.
Briefly explain how the equilibrium price is determined with the help of demand and supply curves.
Advertisements
Solution 1

The X-axis shows the quantity required and provided, while the Y-axis represents the price level. The DD curve indicates demand, whereas the SS curve reflects supply. The demand curve slopes down, whereas the supply curve slopes up. These two curves intersect at point E, which is also known as the equilibrium point. At this point, the quantity required and delivered are exactly equal. The equilibrium price is OP, while the quantity is OQ.
Solution 2
The forces of supply and demand in the market are used to calculate the equilibrium price. The intersection between market supply and demand is identified. Stated differently, the price at which market supply and demand are equal is known as the equilibrium price.
It can be shown with the help of the following table and diagram:
| Price (₹ per shirt) |
Quantity Demanded (000 shirts per month) |
Quantity Supplied (000 shirts per month) |
Market position |
| (1) | (2) | (3) | (4) |
| 500 | 30 | 56 | Excess supply |
| 400 | 40 | 50 | Excess supply |
| 300 | 45 | 45 | Equilibrium |
| 200 | 55 | 35 | Excess demand |
| 100 | 70 | 20 | Excess demand |
From the above table, it is clear that the equilibrium price is ₹ 300 where QD = QS.
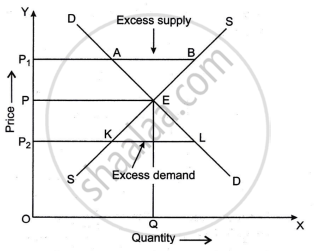
From the above diagram, it is clear that the equilibrium price is P, where QD = QS.
According to the law of variable ratio, as more and more units of a variable factor are applied to a given quantity of fixed factor, the total result initially increases at an increasing rate, but eventually decreases.
Notes
Students should refer to the answer according to their question and preferred marks.
