Advertisements
Advertisements
Question
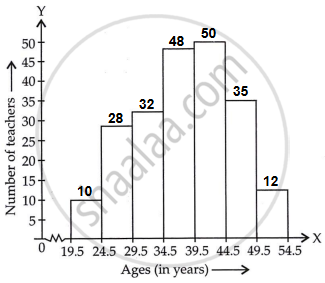
Draw a histogram to represent the following grouped frequency distribution:
| Ages (in years) | Number of teachers |
| 20 – 24 | 10 |
| 25 – 29 | 28 |
| 30 – 34 | 32 |
| 35 – 39 | 48 |
| 40 – 44 | 50 |
| 45 – 49 | 35 |
| 50 – 54 | 12 |
Advertisements
Solution
The given table is in exclusive form.
So, first convert it into an exclusive form, as given below:
| Ages (in years) | Number of teachers |
| 19.5 – 24.5 | 10 |
| 24.5 – 29.5 | 28 |
| 29.5 – 34.5 | 32 |
| 34.5 – 39.5 | 48 |
| 39.5 – 44.5 | 50 |
| 44.5 – 49.5 | 35 |
| 49.5 – 54.5 | 12 |
A histogram for this table is shown in the figure given below:
APPEARS IN
RELATED QUESTIONS
The following table gives the life times of 400 neon lamps:-
| Life time (in hours) | Number of lamps |
| 300 - 400 | 14 |
| 400 - 500 | 56 |
| 500 - 600 | 60 |
| 600 - 700 | 86 |
| 700 - 800 | 74 |
| 800 - 900 | 62 |
| 900 - 1000 | 48 |
- Represent the given information with the help of a histogram.
- How many lamps have a life time of more than 700 hours?
Read the bar graph shown in Fig. 23.8 and answer the following questions:

(i) What is the information given by the bar graph?
(ii) How many tickets of Assam State Lottery were sold by the agent?
(iii) Of which state, were the maximum number of tickets sold?
(iv) State whether true or false.
The maximum number of tickets sold is three times the minimum number of tickets sold.
(v) Of which state were the minimum number of tickets sold?
The following bar graph (Fig. 23. 1 4) represents the heights (in cm) of 50 students of Class XI of a particular school. Study the graph and answer the following questions:

(i) What percentage of the total number of students have their heights more than 149cm?
(ii) How many students in the class are in the range of maximum height of the class?
(iii) The school wants to provide a particular type of tonic to each student below the height
of 150 cm to improve his height. If the cost of the tonic for each student comes out to be Rs. 55, how much amount of money is required?
(iv) How many students are in the range of shortest height of the class?
(v) State whether true or false:
a. There are 9 students in the class whose heights are in the range of 155 - 159 cm.
b. Maximum height (in cm) of a student in the class is 17.
c. There are 29 students in the class whose heights are in the range of 145- 154 cm.
d. Minimum height (in cm) of a student is the class is in the range of 140 – 144 cms.
e. The number of students in the class having their heights less than 150 cm is 12.
f. There are 14 students each of whom has height more than 154. cm.
Read the bar graph given in Fig. 23.19 and answer the following questions:
(i) What information is given by the bar graph?

(ii) In which years the areas under the sugarcane crop were the maximum and the minimum?
(iii) State whether true or false:
The area under the sugarcane crop in the year 1982 - 83 is three times that of the year 1950 - 51
The following data gives the number (in thousands) of applicants registered with an
| Year | 1995 | 1996 | 1997 | 1998 | 1999 | 2000 |
| Number of applicants registered (in thousands) | 18 | 20 | 24 | 28 | 30 | 34 |
Construct a bar graph to represent the above data.

In a histogram, each class rectangle is constructed with base as
The following table gives the frequencies of most commonly used letters a, e, i, o, r, t, u from a page of a book:
| Letters | a | e | i | o | r | t | u |
| Frequency | 75 | 125 | 80 | 70 | 80 | 95 | 75 |
Represent the information above by a bar graph.
Draw a histogram of the following distribution:
| Heights (in cm) | Number of students |
| 150 – 153 | 7 |
| 153 – 156 | 8 |
| 156 – 159 | 14 |
| 159 – 162 | 10 |
| 162 – 165 | 6 |
| 165 – 168 | 5 |
The marks obtained (out of 100) by a class of 80 students are given below:
| Marks | Number of students |
| 10 – 20 | 6 |
| 20 – 30 | 17 |
| 30 – 50 | 15 |
| 50 – 70 | 16 |
| 70 – 100 | 26 |
Construct a histogram to represent the data above.
Following table gives the distribution of students of sections A and B of a class according to the marks obtained by them.
| Section A | Section B | ||
| Marks | Frequency | Marks | Frequency |
| 0 – 15 | 5 | 0 – 15 | 3 |
| 15 – 30 | 12 | 15 – 30 | 16 |
| 30 – 45 | 28 | 30 – 45 | 25 |
| 45 – 60 | 30 | 45 – 60 | 27 |
| 60 –75 | 35 | 60 – 75 | 40 |
| 75 – 90 | 13 | 75 – 90 | 10 |
Represent the marks of the students of both the sections on the same graph by two frequency polygons. What do you observe?
