Advertisements
Advertisements
Question
Draw a histogram for the following distribution:
| Class | 40 – 44 | 45 – 49 | 50 – 54 | 55 – 59 | 60 – 64 | 65 – 69 |
| Frequency | 2 | 8 | 12 | 10 | 6 | 4 |
Advertisements
Solution
Steps:
1. The given frequency distribution is discontinuous, to convert it into continuous distribution.
Adjustment factor = `(45 - 44)/2`
= `1/2`
= 0.5
We construct the continuous frequency table for the given data:
| Classes before adjustment |
Classes after adjustment |
No. of students |
| 40 – 44 | 39.5 – 44.5 | 2 |
| 45 – 49 | 44.5 – 49.5 | 8 |
| 50 – 54 | 49.5 – 54.5 | 12 |
| 55 – 59 | 54.5 – 59.5 | 10 |
| 60 – 64 | 59.5 – 64.5 | 6 |
| 65 – 69 | 64.5 – 69.5 | 4 |
2. Take 2 cm along x-axis = 5 kg and 1 cm along y-axis = 2 (students).
3. Since, the scale on x-axis starts at 39.5, a break (zig-zag curve) is shown near the origin along x-axis to indicate that the graph is drawn to scale beginning at 39.5 and not at origin itself.
4. Construct rectangles corresponding to the given data.
5. In highest rectangle, draw two st. lines AC and BD from corners of the rectangles on either side of the highest rectangle to the opposite corners of the highest rectangle. Let P be the point of intersection of AC and BD.
6. Through P, draw a vertical line to meet the x-axis at M. The abscissa of the point M represents 52.75 kg.
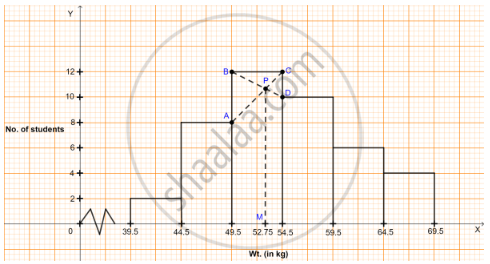
Hence, the required mode = 52.75 kg.
