Advertisements
Advertisements
Questions
Draw a graph which is used to calculate the activation energy of a reaction. Give the appropriate expressions used to calculate the activation energy graphically.
Draw a graph which can be used to calculate the activation energy of a reaction.
Advertisements
Solution
The concept of activation can be understood with the help of Arrhenius equation, which is given as
\[\ce{k = Ae^{-E_a/(RT)}}\]
Where, k is rate constant of the reaction,
A is pre-exponential factor,
Ea activation energy of the reaction,
T is the temperature
R is the universal gas constant
By taking log of above equation, we can reduce it as,
⇒ \[\ce{ln k = ln(Ae^{-E_a/(RT)})}\]
⇒ \[\ce{ln k = ln A + ln (e^{-E_a/(RT)})}\]
⇒ \[\ce{ln k = ln (A) + \frac{-E_a}{RT} ln (e)}\]
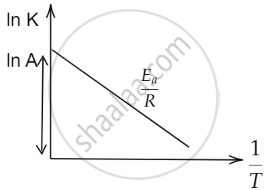
⇒ \[\ce{ln k = \frac{-E_a}{R} (\frac{1}{T}) + ln (A)}\]
On comparing above equation with
y = mx + c
we get that,
\[\ce{m = \frac{-E_a}{R}}\], with X- axis as \[\ce{\frac{1}{T}}\] along the Y-axis as ln k and a constant of ln(A). Therefore, we can plot the graph as:
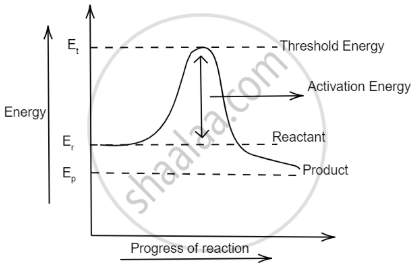
Also, the graph between the energy of reaction and progress of reaction can be plotted as:
Notes
Students should refer to the answer according to their questions.
