Advertisements
Advertisements
Question
Calculate the mode from the following data:
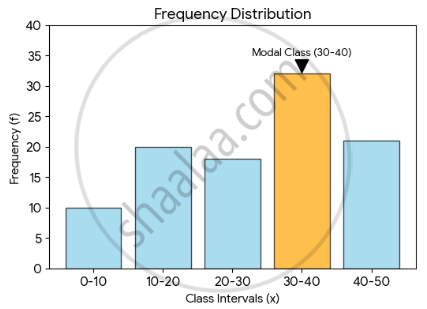
| x | 0 – 10 | 10 – 20 | 20 – 30 | 30 – 40 | 40 – 50 |
| f | 10 | 20 | 18 | 32 | 21 |
Advertisements
Solution
1. Identify the modal class
The modal class is the class interval with the highest frequency. In this dataset, the maximum frequency is 32, which corresponds to the class interval 30 – 40.
2. Note the required values
From the modal class and surrounding data, we identify the following values for the formula:
l (Lower limit of the modal class) = 30
f1 (Frequency of the modal class) = 32
f0 (Frequency of the preceding class) = 18
f2 (Frequency of the succeeding class) = 21
h (Class width/size) = 10
3. Apply the mode formula
The formula for the mode of grouped data is:
Mode = `l + ((f_1 - f_0)/(2f_1 - f_0 - f_2)) xx h`
Substitute the values into the formula:
Mode = `30 + ((32 - 18)/(2(32) - 18 - 21)) xx 10`
4. Solve the calculation
Simplify the expression step-by-step:
Mode = `30 + (14/(64 - 39)) xx 10`
Mode = `30 + (14/25) xx 10`
Mode = 30 + (0.56 × 10)
Mode = 30 + 5.6
Mode = 35.6
The final mode of the given data is 35.6.
