Advertisements
Advertisements
Question
Answer the following question in about 125 words:
Explain relative positions of mean, median and mode in a normal distribution and skewed distribution with the help of diagrams.
Advertisements
Solution
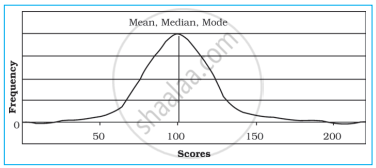
1. Normal Curve: In this curve, the highest frequency is at the centre, and both tails on the left and right-hand sides are in an identical fashion. It is a unimodal curve in which the mean, median, and mode are equal. It is also known as a bell-shaped or symmetrical curve. It is shown below:
2. Positively Skewed Curve: It is an asymmetrical curve that has a tail on the right-hand side of the graph, and frequencies are more for the lower values of the data. These histograms have the curve on the left side of the distribution. If the right tail is longer, the distribution’s mass is concentrated on the left. It has relatively few low values. It is shown below:

3. Negatively Skewed Curve: It is an asymmetrical curve that has a tail on the left-hand side of the graph, and frequencies are more for the higher values of the data. The left tail is longer, and the mass of the distribution is concentrated on the right of the figure. It has relatively few low values. The distribution is left-skewed. It is shown below:

