Advertisements
Advertisements
Question
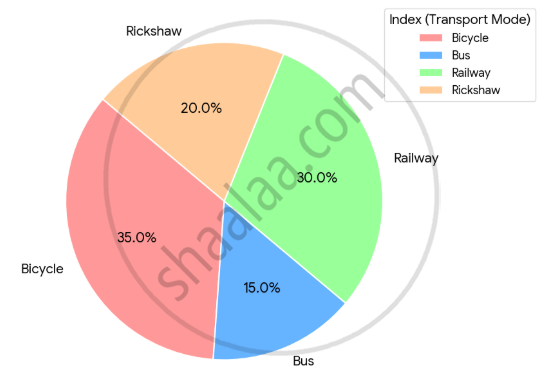
A survey was conducted in the school. Students using different modes of transport are given below:
| Mode of Transport | Percentage of Students |
| Bicycle | 35 |
| Bus | a |
| Railway | 2a |
| Rickshaw | 20 |
Find the value of a and draw the Pie diagram.
Diagram
Sum
Advertisements
Solution
Sum of all percentages = 100%
35 + a + 2a + 20 = 100
55 + 3a = 100
3a = 100 − 55
3a = 45
a = `45/3`
a = 15
The percentage for Bus is 15%
The percentage for the railway = 2 × 15
= 30%
| Mode of Transport | Percentage of Students | Percentage of students preferring transport type | Central Angle |
| Bicycle | 35 | `35/100 xx 360°` | 126° |
| Bus | 15 | `15/100 xx 360°` | 54° |
| Railway | 30 | `30/100 xx 360°` | 108° |
| Rickshaw | 20 | `20/100 xx 360°` | 72 |
| Total | 100 | 360° |
shaalaa.com
Is there an error in this question or solution?
2025-2026 (March) Board Question Paper
