Advertisements
Advertisements
Question
A life insurance agent found the following data for distribution of ages of 100 policy holders.
| Age in years | Policy Holders (frequency) |
Cumulative frequency |
| 20 – 25 | 2 | 2 |
| 25 – 30 | 4 | 6 |
| 30 – 35 | 12 | 18 |
| 35 – 40 | 20 | 38 |
| 40 – 45 | 28 | 66 |
| 45 – 50 | 22 | 88 |
| 50 – 55 | 8 | 96 |
| 55 – 60 | 4 | 100 |
On a graph sheet draw an ogive using the given data. Take 2 cm = 5 years along one axis and 2 cm = 10 policy holders along the other axis.
Use your graph to find:
- The median age.
- Number of policy holders whose age is above 52 years.
Advertisements
Solution
1. Construct the Ogive
To draw a “less than“ ogive, we plot the cumulative frequency against the upper class boundaries of the age intervals.
Plotting Points: (20, 0), (25, 2), (30, 6), (35, 18), (40, 38), (45, 66), (50, 88), (55, 96), (60, 100).
Scale: Use 2 cm = 5 years on the x-axis and 2 cm = 10 policy holders on the y-axis as requested.
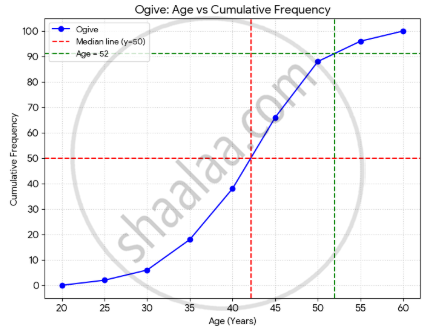
2. Find the median age
1. Locate median point: Since the total number of policy holders (N) is 100, the median is at the `N/2` = 50th position.
2. Read from graph: From 50 on the y-axis, draw a horizontal line to the curve, then a vertical line down to the x-axis.
3. Result: The point on the x-axis is approximately 42.14 years.
3. Number of policy holders above 52 years
1. Locate age 52: Find 52 on the x-axis and draw a vertical line up to the curve.
2. Find cumulative frequency: Move horizontally to the y-axis. The cumulative frequency at age 52 is approximately 91.
3. Calculate remaining: To find those above age 52, subtract this value from the total: 100 – 91 = 9.
4. Result: Approximately 9 policy holders are older than 52 years.
The median age is 42.14 years and the number of policy holders above 52 years is 9.
