Advertisements
Advertisements
C-peptide of human insulin is ______.
Concept: Applications of Biotechnology in Health and Medicine
Explain how recombinant human insulin was prepared in 1983 by Eli Lily an American company.
Concept: Applications of Biotechnology in Health and Medicine
Eli Lilly's contribution for diabetic patients through r-DNA technology has been overwhelmingly accepted. Explain how?
Concept: Applications of Biotechnology in Health and Medicine
- Assertion: PCR is a powerful technique to identify genetic disorders.
- Reason: PCR can detect mutations in low amounts of DNA.
Concept: Applications of Biotechnology in Health and Medicine
The graph given below indicates the administration of the first (L) and second dose (M) of a vaccine. The corresponding response of the body is indicated by X, and Y. Interpret the graph and explain the reason for such a response shown by the body.
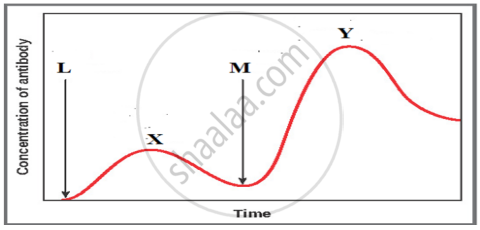
Concept: Applications of Biotechnology in Health and Medicine
Explain mutualism with the help of any two examples.
Concept: Population Interactions
Write what do phytophagous insects feed on.
Concept: Population Interactions
Why do clown fish and sea anemone pair up? What is this relationship called?
Concept: Population Interactions
How do mycorrhizae help the plants to grow better?
Concept: Population and Population Attributes >> Life History Variation
How is mutualism different from commensalism?
Concept: Population Interactions
Name the two intermediate hosts which the human liver fluke depends on to complete its life cycle so as to facilitate parasitization of its primary host.
Concept: Population Interactions
Answer the following question.
Mention the term used to describe a population interaction between an orchid growing on a forest tree.
Concept: Population Interactions
Answer the following question.
Mention the term used to describe a population interaction between an orchid growing on a forest tree.
Concept: Population Interactions
Name and explain the interaction that is seen between clownfish and sea anemones.
Concept: Population Interactions
Substantiate by giving two reasons as to why a holistic understanding of the flora and fauna the cropland is required before introducing an appropriate biocontrol method.
Concept: Population Interactions
With the decline in the population of fig species it was noticed that the population of wasp species also started to decline. What is the relationship between the two and what could be the possible reason for decline of wasps?
Concept: Population Interactions
What is mycorrhiza?
Concept: Population Interactions
Sea Anemone gets attached to the surface of the hermit crab. The kind of population interaction exhibited in this case is ______.
Concept: Population Interactions
Write the observations made at the end of Connell's field, experiment on barnacles on the rocky sea coasts of Scotland.
Concept: Population Interactions
Name any two categories of organisms that in general are adversely affected by competition.
Concept: Population Interactions
