Advertisements
Advertisements
प्रश्न
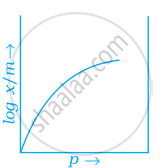
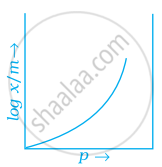
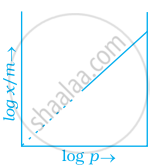
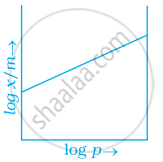
Which of the following curves is in accordance with Freundlich adsorption isotherm?
पर्याय
Advertisements
उत्तर
Explanation:
Freundlich, in 1909, gave an empirical relationship between the quantity of gas adsorbed by unit mass of solid adsorbent and pressure at a particular temperature.
`x/m= kp^(1/n) (n > 1)`
The adsorption varies directly. Where `x/m` = mass of gas adsorbed per unit mass of adsorbent particle p = Pressure of gas at particular temperature.
APPEARS IN
संबंधित प्रश्न
What is an adsorption isotherm?
Describe Freundlich adsorption isotherm.
How is activation of adsorbent achieved?
In reference to Freundlich adsorption isotherm, write the expression for adsorption of gases on solids in the form of an equation.
Answer in one sentence:
Write an equation for Freundlich adsorption isotherm.
Explain graphically Freundlich adsorption isotherm.
The slope and intercept for plot of `log_10 "x"/"m"` against log10P for Freundlich equation are ____________ and ____________ respectively.
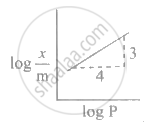
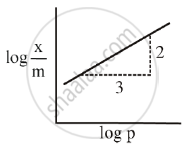
Adsorption of a gas follows Freundlich adsorption isotherm. x is the mass of the gas adsorbed on mass m of the adsorbent. The plot of log `"x"/"m"`· versus log P is shown in the given m graph. `"x"/"m"` is proportional to
Freundlich's equation for adsorption of gas on solid is represented as ____________.
In Freundlich's adsorption isotherm, when log `("x"/"m")` is plotted against log P, slope of the graph is ____________.
Adsorption of gases on the solid surface is generally exothermic because.
Langmuir adsorption isotherm works particularly well.
Which of the following statement is INCORRECT regarding the adsorption of a gas on the surface of the solid?
The mass of gas adsorbed, x per unit mass of adsorbed, m was measured at various x pressures p. A graph between `log "x"/"m"` and log p gives a straight line with slope equal to 2 and the intercept equal to 0.4771. The value of `"x"/"m"` at a pressure of 4 atm is ______.
[Given log 3 = 0.4771]
Adsorption of a gas follows Freundlich adsorption isotherm. x is the mass of the gas adsorbed on mass m of the adsorbent. The x plot of log `x/m` versus log p is shown in the given graph. `x/m` is proportional to ______.
For Freundlich adsorption isotherm, a plot of log (x/m) (Y-axis) and log p (x-axis) gives a straight line. The intercept and slope for the line is 0.4771 and 2, respectively. The mass of gas, adsorbed per gram of adsorbent if the initial pressure is 0.04 atm, is ______ × 10-4 g. (log 3 = 0.4771)
