Advertisements
Advertisements
प्रश्न
The lengths (in the nearest centimetre) of 30 drumsticks are given as follows.
| Lengths | Number of drumsticks |
| 24 | |||| |
| 25 | -- |
| 26 | -- |
| 27 | |||| | |
| 28 | -- |
| 29 | |||| ||| |
| 30 | |||| | |
| 31 | |||| |
Draw the bar graph showing the same information.
Advertisements
उत्तर
The lengths (in nearest cm) of drumsticks
Scale: 1 Unit = 1 drumstick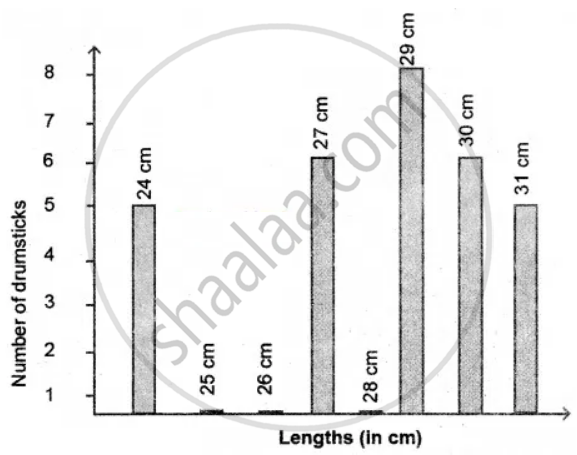
APPEARS IN
संबंधित प्रश्न
The table below gives the number of children who took part in the various items of the talent show as part of the annual school gathering. Make a bar graph to show this data.
(Scale: on Y-axis, 1cm = 4 children)
| Programme | Theatre | Dance | Vocal music | Instrumental music | One-act plays |
| No. of students | 24 | 40 | 16 | 8 | 4 |
The number of customers who came to a juice centre for one week is given in the table below. Make two different bar graphs to show this data. (Scale: on Y-axis, 1cm = 10 customers, on Y - axis, 1cm = 5 customers)
| Type of juice | Orange | Pineapple | Apple | Mango | Pomegranate |
| No. of Customers | 50 | 30 | 25 | 65 | 10 |
Students planted trees in 5 villages of Sangli district. Make a bar graph of this data. (Scale: on Y-axis, 1cm = 100 trees)
| Name of place | Dudhgaon | Bagni | Samdoli | Ashta | Kavathepiran |
| No. of trees planted | 500 | 350 | 600 | 420 | 540 |
The fruits liked by the students of a class are as follow: Draw a Bar Graph for this data.
| Fruits | Bananas | Grapes | Apples | Mangoes | Guavas | Papayas | Other fruits |
| Number of students |
8 | 10 | 8 | 7 | 12 | 3 | 2 |
The pictograph below gives the number of absentees on different days of the week in class six. Draw the Bar graph for the same.
| Day | Monday | Tuesday | Wednesday | Thursday | Friday | Saturday |
| Number of Absentees |  |
 |
 |
 |
-- |  |
represents 4 students represents 2 students
Draw a graph for the radius and circumference of circle using a suitable scale.
(Hint: Take radius = 7, 14, 21 units and so on)
From the graph,
- Find the circumference of the circle when radius is 42 units.
- At what radius will the circumference of the circle be 220 units?
The following table represents income of a Gram Panchayat from different sources in a particular year:
| Sources | Income (in Rs.) |
| Income from local taxes | 75000 |
| Funds received from government | 150000 |
| Donations | 25000 |
| Income from other resources | 50000 |
Draw a bar graph to represent the above information.
Home appliances sold by a shop in one month are given as below:
| Home appliance | Number of home appliances |
| Refrigerator | 75 |
| Television | 45 |
| Washing Machine | 30 |
| Cooler | 60 |
| DVD Player | 30 |
Draw a bar graph to represent the above information.
In a botanical garden, the number of different types of plants are found as follows:
| Type of the plants | Number of plants |
| Herb | 50 |
| Shrub | 60 |
| Creeper | 20 |
| Climber | 45 |
| Tree | 95 |
Draw a bar graph to represent the above information and answer the following questions:
- Which type of plant is maximum in number in the garden?
- Which type of plant is minimum in number in the garden?
What is the primary characteristic that distinguishes bar graphs from other forms of data representation?
