Advertisements
Advertisements
प्रश्न
Solve the following problem :
Following table shows the amount of sugar production (in lac tonnes) for the years 1971 to 1982.
| Year | 1971 | 1972 | 1973 | 1974 | 1975 | 1976 | 1977 | 1978 | 1979 | 1980 | 1981 | 1982 |
| Production | 1 | 0 | 1 | 2 | 3 | 2 | 3 | 6 | 5 | 1 | 4 | 10 |
Fit a trend line to the above data by graphical method.
Advertisements
उत्तर
Taking year on X-axis and production on Y-axis, we plot the points for production corresponding to years. Joining these points we get the graph of time series. We fit a trend line as shown in the graph.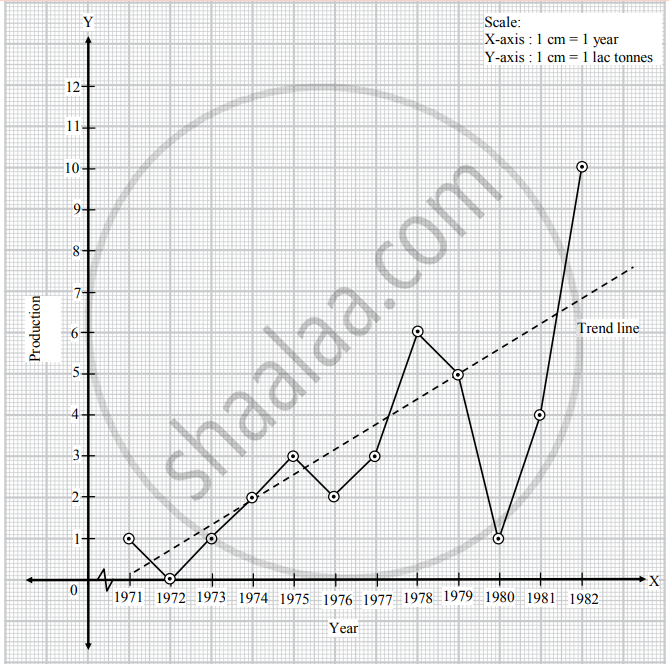
APPEARS IN
संबंधित प्रश्न
Obtain the trend values for the data in using 4-yearly centered moving averages.
| Year | 1976 | 1977 | 1978 | 1979 | 1980 | 1981 | 1982 | 1983 | 1984 | 1985 |
| Index | 0 | 2 | 3 | 3 | 2 | 4 | 5 | 6 | 7 | 10 |
Fit a trend line to the data in Problem 7 by the method of least squares. Also, obtain the trend value for the year 1990.
Obtain the trend values for the above data using 3-yearly moving averages.
The following table shows the production of gasoline in U.S.A. for the years 1962 to 1976.
| Year | 1962 | 1963 | 1964 | 1965 | 1966 | 1967 | 1968 | 1969 | 1970 | 1971 | 1972 | 1973 | 1974 | 1975 | 1976 |
| Production (Million Barrels) |
0 | 0 | 1 | 1 | 2 | 3 | 4 | 5 | 6 | 7 | 8 | 9 | 8 | 9 | 10 |
i. Obtain trend values for the above data using 5-yearly moving averages.
ii. Plot the original time series and trend values obtained above on the same graph.
Choose the correct alternative :
Which of the following is a major problem for forecasting, especially when using the method of least squares?
Choose the correct alternative :
What is a disadvantage of the graphical method of determining a trend line?
State whether the following is True or False :
Graphical method of finding trend is very complicated and involves several calculations.
State whether the following is True or False :
Moving average method of finding trend is very complicated and involves several calculations.
Solve the following problem :
Fit a trend line to data in Problem 4 by the method of least squares.
Solve the following problem :
The percentage of girls’ enrollment in total enrollment for years 1960-2005 is shown in the following table.
| Year | 1960 | 1965 | 1970 | 1975 | 1980 | 1985 | 1990 | 1995 | 2000 | 2005 |
| Percentage | 0 | 3 | 3 | 4 | 4 | 5 | 6 | 8 | 8 | 10 |
Fit a trend line to the above data by graphical method.
Solve the following problem :
Fit a trend line to the data in Problem 7 by the method of least squares.
Solve the following problem :
Obtain trend values for the data in Problem 7 using 4-yearly moving averages.
Solve the following problem :
Fit a trend line to data by the method of least squares.
| Year | 1977 | 1978 | 1979 | 1980 | 1981 | 1982 | 1983 | 1984 |
| Number of boxes (in ten thousands) | 1 | 0 | 3 | 8 | 10 | 4 | 5 | 8 |
Solve the following problem :
Obtain trend values for data in Problem 10 using 3-yearly moving averages.
Solve the following problem :
Obtain trend values for data in Problem 16 using 3-yearly moving averages.
The simplest method of measuring trend of time series is ______
The method of measuring trend of time series using only averages is ______
Obtain trend values for data, using 4-yearly centred moving averages
| Year | 1971 | 1972 | 1973 | 1974 | 1975 | 1976 |
| Production | 1 | 0 | 1 | 2 | 3 | 2 |
| Year | 1977 | 1978 | 1979 | 1980 | 1981 | 1982 |
| Production | 4 | 6 | 5 | 1 | 4 | 10 |
Following table shows the all India infant mortality rates (per ‘000) for years 1980 to 2010
| Year | 1980 | 1985 | 1990 | 1995 |
| IMR | 10 | 7 | 5 | 4 |
| Year | 2000 | 2005 | 2010 | |
| IMR | 3 | 1 | 0 |
Fit a trend line by the method of least squares
Solution: Let us fit equation of trend line for above data.
Let the equation of trend line be y = a + bx .....(i)
Here n = 7(odd), middle year is `square` and h = 5
| Year | IMR (y) | x | x2 | x.y |
| 1980 | 10 | – 3 | 9 | – 30 |
| 1985 | 7 | – 2 | 4 | – 14 |
| 1990 | 5 | – 1 | 1 | – 5 |
| 1995 | 4 | 0 | 0 | 0 |
| 2000 | 3 | 1 | 1 | 3 |
| 2005 | 1 | 2 | 4 | 2 |
| 2010 | 0 | 3 | 9 | 0 |
| Total | 30 | 0 | 28 | – 44 |
The normal equations are
Σy = na + bΣx
As, Σx = 0, a = `square`
Also, Σxy = aΣx + bΣx2
As, Σx = 0, b =`square`
∴ The equation of trend line is y = `square`
Fit equation of trend line for the data given below.
| Year | Production (y) | x | x2 | xy |
| 2006 | 19 | – 9 | 81 | – 171 |
| 2007 | 20 | – 7 | 49 | – 140 |
| 2008 | 14 | – 5 | 25 | – 70 |
| 2009 | 16 | – 3 | 9 | – 48 |
| 2010 | 17 | – 1 | 1 | – 17 |
| 2011 | 16 | 1 | 1 | 16 |
| 2012 | 18 | 3 | 9 | 54 |
| 2013 | 17 | 5 | 25 | 85 |
| 2014 | 21 | 7 | 49 | 147 |
| 2015 | 19 | 9 | 81 | 171 |
| Total | 177 | 0 | 330 | 27 |
Let the equation of trend line be y = a + bx .....(i)
Here n = `square` (even), two middle years are `square` and 2011, and h = `square`
The normal equations are Σy = na + bΣx
As Σx = 0, a = `square`
Also, Σxy = aΣx + bΣx2
As Σx = 0, b = `square`
Substitute values of a and b in equation (i) the equation of trend line is `square`
To find trend value for the year 2016, put x = `square` in the above equation.
y = `square`
Complete the table using 4 yearly moving average method.
| Year | Production | 4 yearly moving total |
4 yearly centered total |
4 yearly centered moving average (trend values) |
| 2006 | 19 | – | – | |
| `square` | ||||
| 2007 | 20 | – | `square` | |
| 72 | ||||
| 2008 | 17 | 142 | 17.75 | |
| 70 | ||||
| 2009 | 16 | `square` | 17 | |
| `square` | ||||
| 2010 | 17 | 133 | `square` | |
| 67 | ||||
| 2011 | 16 | `square` | `square` | |
| `square` | ||||
| 2012 | 18 | 140 | 17.5 | |
| 72 | ||||
| 2013 | 17 | 147 | 18.375 | |
| 75 | ||||
| 2014 | 21 | – | – | |
| – | ||||
| 2015 | 19 | – | – |
Following table shows the amount of sugar production (in lakh tonnes) for the years 1931 to 1941:
| Year | Production | Year | Production |
| 1931 | 1 | 1937 | 8 |
| 1932 | 0 | 1938 | 6 |
| 1933 | 1 | 1939 | 5 |
| 1934 | 2 | 1940 | 1 |
| 1935 | 3 | 1941 | 4 |
| 1936 | 2 |
Complete the following activity to fit a trend line by method of least squares:
The complicated but efficient method of measuring trend of time series is ______.
Complete the following activity to fit a trend line to the following data by the method of least squares.
| Year | 1975 | 1976 | 1977 | 1978 | 1979 | 1980 | 1981 | 1982 | 1983 |
| Number of deaths | 0 | 6 | 3 | 8 | 2 | 9 | 4 | 5 | 10 |
Solution:
Here n = 9. We transform year t to u by taking u = t - 1979. We construct the following table for calculation :
| Year t | Number of deaths xt | u = t - 1979 | u2 | uxt |
| 1975 | 0 | - 4 | 16 | 0 |
| 1976 | 6 | - 3 | 9 | - 18 |
| 1977 | 3 | - 2 | 4 | - 6 |
| 1978 | 8 | - 1 | 1 | - 8 |
| 1979 | 2 | 0 | 0 | 0 |
| 1980 | 9 | 1 | 1 | 9 |
| 1981 | 4 | 2 | 4 | 8 |
| 1982 | 5 | 3 | 9 | 15 |
| 1983 | 10 | 4 | 16 | 40 |
| `sumx_t` =47 | `sumu`=0 | `sumu^2=60` | `square` |
The equation of trend line is xt= a' + b'u.
The normal equations are,
`sumx_t = na^' + b^' sumu` ...(1)
`sumux_t = a^'sumu + b^'sumu^2` ...(2)
Here, n = 9, `sumx_t = 47, sumu= 0, sumu^2 = 60`
By putting these values in normal equations, we get
47 = 9a' + b' (0) ...(3)
40 = a'(0) + b'(60) ...(4)
From equation (3), we get a' = `square`
From equation (4), we get b' = `square`
∴ the equation of trend line is xt = `square`
Following table gives the number of road accidents (in thousands) due to overspeeding in Maharashtra for 9 years. Complete the following activity to find the trend by the method of least squares.
| Year | 2008 | 2009 | 2010 | 2011 | 2012 | 2013 | 2014 | 2015 | 2016 |
| Number of accidents | 39 | 18 | 21 | 28 | 27 | 27 | 23 | 25 | 22 |
Solution:
We take origin to 18, we get, the number of accidents as follows:
| Year | Number of accidents xt | t | u = t - 5 | u2 | u.xt |
| 2008 | 21 | 1 | -4 | 16 | -84 |
| 2009 | 0 | 2 | -3 | 9 | 0 |
| 2010 | 3 | 3 | -2 | 4 | -6 |
| 2011 | 10 | 4 | -1 | 1 | -10 |
| 2012 | 9 | 5 | 0 | 0 | 0 |
| 2013 | 9 | 6 | 1 | 1 | 9 |
| 2014 | 5 | 7 | 2 | 4 | 10 |
| 2015 | 7 | 8 | 3 | 9 | 21 |
| 2016 | 4 | 9 | 4 | 16 | 16 |
| `sumx_t=68` | - | `sumu=0` | `sumu^2=60` | `square` |
The equation of trend is xt =a'+ b'u.
The normal equations are,
`sumx_t=na^'+b^'sumu ...(1)`
`sumux_t=a^'sumu+b^'sumu^2 ...(2)`
Here, n = 9, `sumx_t=68,sumu=0,sumu^2=60,sumux_t=-44`
Putting these values in normal equations, we get
68 = 9a' + b'(0) ...(3)
∴ a' = `square`
-44 = a'(0) + b'(60) ...(4)
∴ b' = `square`
The equation of trend line is given by
xt = `square`
