Advertisements
Advertisements
प्रश्न
On an outline map of India, show the following.
- Areas receiving rainfall over 400 cm.
- Areas receiving less than 20 cm of rainfall.
- The direction of the south-west monsoon over India.
Advertisements
उत्तर
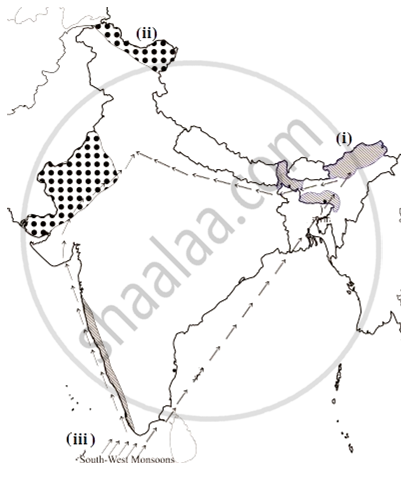
- The Western Coast and NorthEastern India receive rainfall over 400 cm. Mawsynram and Cherrapunji in Meghalaya are known for receiving maximum rainfall in the world. The Andaman Islands and Lakshadweep Islands are also known to receive annual rainfall above 400 cm.
- The parts of Northern Kashmir, Western Rajasthan, Deccan plateau, and Punjab are known to be the areas that receive scanty rainfall that is less than 20 cm. In the Northern part of India, rainfall decreases toward the west, while in the peninsular region except for Tamil Nadu, the rainfall decreases eastwards.
- South-west monsoon is a compound and a self-evolved weather system unique to the Indian subcontinent. The south west monsoon in India moves in south-west direction. In India, there are only south-west and north-east monsoons. Because of the Coriolis effect, the south-east monsoon becomes south-west trade winds.
APPEARS IN
संबंधित प्रश्न
India’s climate is of ______________ type
In the upper layers of the troposphere ______ are found.
Match the following.
| 1. | Gulf of Mannar | Odisha |
| 2. | Simlipal | West Bengal |
| 3. | kanchenjunga | Meghalaya |
| 4. | Nokrek | Tamil Nadu |
| 5. | Sunderbans | Sikkim |
Which regions of India still has natural vegetation in real sense?
Match the following:
| A | B | ||
| 1. | Manaus | a. | Low rainfall region |
| 2. | Rajasthan | b. | Nucleated settlements |
| 3. | Highlands of Brazil | c. | Bengal Tiger |
| 4. | North Indian Plains | d. | Animals of grasslands |
| e. | Swampy region | ||
| f. | Not much difference in the range of temperature |
Write a short note.
Comparison of the climate of India and Brazil.
Why does the coromandal coast face frequent cyclones?
Find out which songs, dances, festivals and special food preparations are associated with certain seasons in your region. Do they have some commonality with other regions of India?
Now think why Jodhpur has a hot desert type of climate?
In spite of these facts see carefully if there is strong evidence to conclude that the monsoons still provide a very strong framework lending overall climatic unity to the whole country.
Observe the given figure and write the answers.
 |
- Which region gets more than 4000 mm of rainfall?
- Identify the regions with maximum and minimum temperatures?
- In which direction is the temperature increasing?
- Identify the direction of the winds shown. What are they known as?
- Which winds are responsible for the rainfall in India ?
- Some part of Rajasthan is under desert? What could be the reason for it?
- Draw the main parallel of latitude passing through India which affects its climate.
- In which part of Peninsular India are semi-arid climatic conditions found and why?
