Advertisements
Advertisements
प्रश्न
On a graph paper plot the points A (3, 0), B(3, 3), C(0, 3). Join A, B and B, C. What is the figure formed?
Advertisements
उत्तर
The given points are A(3, 0), B(3, 3) and C(0, 3). These points can be plotted on the co-ordinate plane as follows:

The x co-ordinate of point is its distance from the Y-axis and y co-ordinate of point is its distance from the X-axis.
Here, OA = AB = BC = OC = 3 units
Therefore, the figure formed is a square.
APPEARS IN
संबंधित प्रश्न
In which quadrant or on which axis do each of the points (– 2, 4), (3, – 1), (– 1, 0), (1, 2) and (– 3, – 5) lie? Verify your answer by locating them on the Cartesian plane.
Plot the following point on the graph paper:
(−3, 2)
Plot the following points on the one and the same co-ordinate system.
A(1, 3), B(-3, -1), C(1, -4), D(-2, 3), E(0, -8), F(1, 0)
Plot the following point in the coordinate system and identify the quadrant.
P(−7, 6)
Plot the following point in the coordinate system and identify the quadrant.
T(3, 9)
Plot the following points in the coordinate plane. Join them in order. What type of geometrical shape is formed?
(0, 0) (−4, 0) (−4, −4) (0, −4)
On plotting the points O(0, 0), A(3, 0), B(3, 4), C(0, 4) and joining OA, AB, BC and CO which of the following figure is obtained?
Plot the following point in a graph sheet.
A(5, 2)
Plot the following point in a graph sheet.
E(0, −5)
Plot the following point in a graph sheet.
H(−4, 0)
Find the quadrants without plotting the point on a graph sheet
(−3, −5)
Find the quadrants without plotting the point on a graph sheet
(4, −3)
Plot the following point in a graph sheet.
I(2, 3)
Plot the following point in a graph sheet.
K(0, 7)
Use the graph to determine the coordinates where each figure is located.
| a) Star | _______ |
| b) Bird | _______ |
| c) Red circle | _______ |
| d) Diamond | _______ |
| e) Triangle | _______ |
| f) Ant | _______ |
| g) Mango | _______ |
| h) Housefly | _______ |
| i) Medal | _______ |
| j) Spider | _______ |
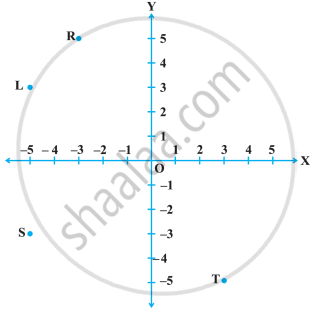
In the following figure, the point identified by the coordinates (–5, 3) is ______.
Plot the points (x, y) given by the following table:
| x | 2 | 4 | – 3 | – 2 | 3 | 0 |
| y | 4 | 2 | 0 | 5 | – 3 | 0 |
Plot the points A(1, – 1) and B(4, 5). Extend this line segment and write the coordinates of a point on this line which lies outside the line segment AB.
