Advertisements
Advertisements
प्रश्न
Advertisements
उत्तर
The presentation of the data in a tabular form helps in quickly grasping and analyzing the recorded observations. For example, to measure a diameter using a vernier caliper we record the following data in a tabular form as follows
Vernier caliper
| No. of observations | Main scale reading (cm) | No. of vernier divisions p coinciding with main scale | Vernier reading =L.C. X p (cm) | Observed diameter |
| 1 | ||||
| 2 | ||||
| 3 |
The measurements corresponding to one physical quantity from one instrument must be recorded in one table. And the name of the instrument should be written on top. Observation must be recorded up to the limit of the instrument and form the recorded individual observations, calculate the mean value, and record it at the bottom of the column.
संबंधित प्रश्न
The wavelength of light of a particular colour is 5800 Å.
Express it in nanometre.
The final result of the calculation in an experiment is 125,347,200. Express the number in term of significant place when accuracy is between 1 and 10
The final result of the calculation in an experiment is 125,347,200. Express the number in term of significant place when accuracy is between 1 and 100
How do you account for positive zero error for calculating the correct diameter of wires?
How the backlash error is avoided?
State whether the following statement is true or false by writing T/F against it.
A metre scale can measure a length of 6.346 cm.
What is the least count in the case of the following instrument?
vernier calipers
What is the least count in the case of the following instrument?
Screw gauge
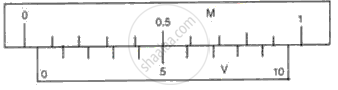
Consider the following case where the zero of vernier scale and the zero of the main scale are clearly seen. If L.C. of the vernier calipers is 0.01 cm, write the zero error and zero correction of the following.