Advertisements
Advertisements
प्रश्न
Draw a graph of the equation 5x - 3y = 1. From the graph find the value of:
(i) x, when y = 8
(ii) y, when x = 2
Advertisements
उत्तर
We have
5x - 3y = 1
⇒ -3y = 1 - 5x
⇒ 3y = 5x - 1
⇒ y = `(5x - 1)/(3)`
When x = -2
⇒ y = `-(11)/(3)` = -3.66
When x = 0
⇒ y = `-(1)/(3)` = -0.33
When x = 2
⇒y = `(9)/(3)` = 3
| x | -2 | -1 | 0 | 1 | 2 |
| y | -3.66 | -2 | -0.33 | 1.33 | 3 |
Thus ordered pairs of 5x - 3y = 1 are {(-2, -3.66), (-1, -2), (0, -0.33), (1, 1.33), (2, 3)}. Hence graph is a below.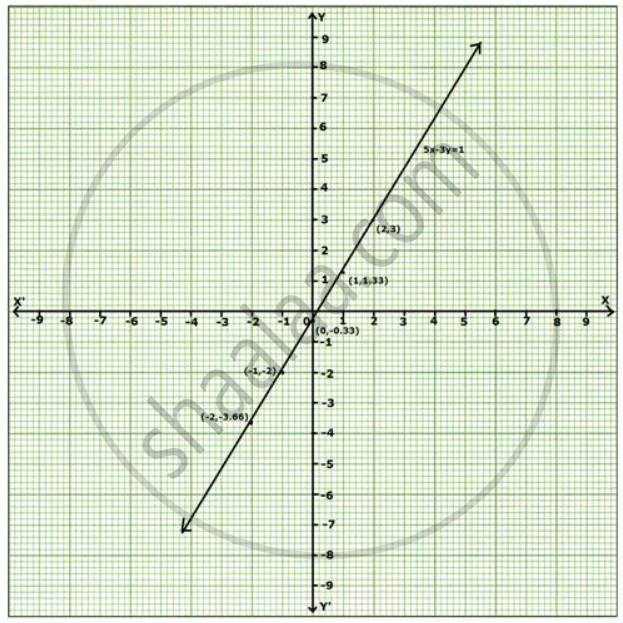
(i) x, when y = 8
From graph we find that x = 5, when y = 8
(ii) y, when x = 2
From graph we find that y = 3, when x = 2.
APPEARS IN
संबंधित प्रश्न
Draw the graph for the linear equation given below:
x = 0
Draw the graph for the linear equation given below:
y = 3x
Draw the graph for the linear equation given below:
y = `(2x)/(3) - 1`
Draw the graph for the linear equation given below:
y = - x + 4
Draw the graph for the linear equation given below:
y = `4x - (5)/(2)`
Draw the graph for the each linear equation given below:
y = `(3x)/(2) + (2)/(3)`
For the pair of linear equations given below, draw graphs and then state, whether the lines drawn are parallel or perpendicular to each other.
3x + 4y = 24
`x/(4) + y/(3) = 1`
Use the graphical method to show that the straight lines given by the equations x + y = 2, x - 2y = 5 and `x/(3) + y = 0` pass through the same point.
Draw a graph of each of the following equations: 3x - 2y = 6
Draw a graph for each of the following equations and find the coordinates of the points where the line drawn meets the x-axis and y-axis: `(2x)/(5) + y/(2)` = 1
