Advertisements
Advertisements
प्रश्न
Draw a graph between volume and temperature, when 5 cm3 of ice at -10°C is heated to form water at +10°C.
Advertisements
उत्तर

Mass 5 cm3 of water is 5 g
Volume of water in minimum at 4°C.
APPEARS IN
संबंधित प्रश्न
On what basis and how will you determine whether air is saturated with vapour or not?
A 50 kg man is running at a speed of 18 km h−1. If all the kinetic energy of the man can be used to increase the temperature of water from 20°C to 30°C, how much water can be heated with this energy?
At what temperature is the density of water is maximum? State its value.
Draw a graph to show the variation in density of water with temperature in the range from 0°C to 10°C.
Explain the following
A hollow glass sphere which floats with its entire volume submerged in water at 4°C, sinks when water is heated above 4°C.
Why does a thick glass tumbler crack when very hot water is poured in it?
Observe the given picture and answer the following questions.
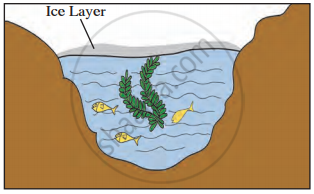
- Which property do you understand in this picture?
- What is the temperature of the water at the surface?
- What is the temperature below the layer of ice on the surface?
